29
/
en
AIzaSyAYiBZKx7MnpbEhh9jyipgxe19OcubqV5w
April 1, 2024
246137
South Africa
ZAF
true
2
1
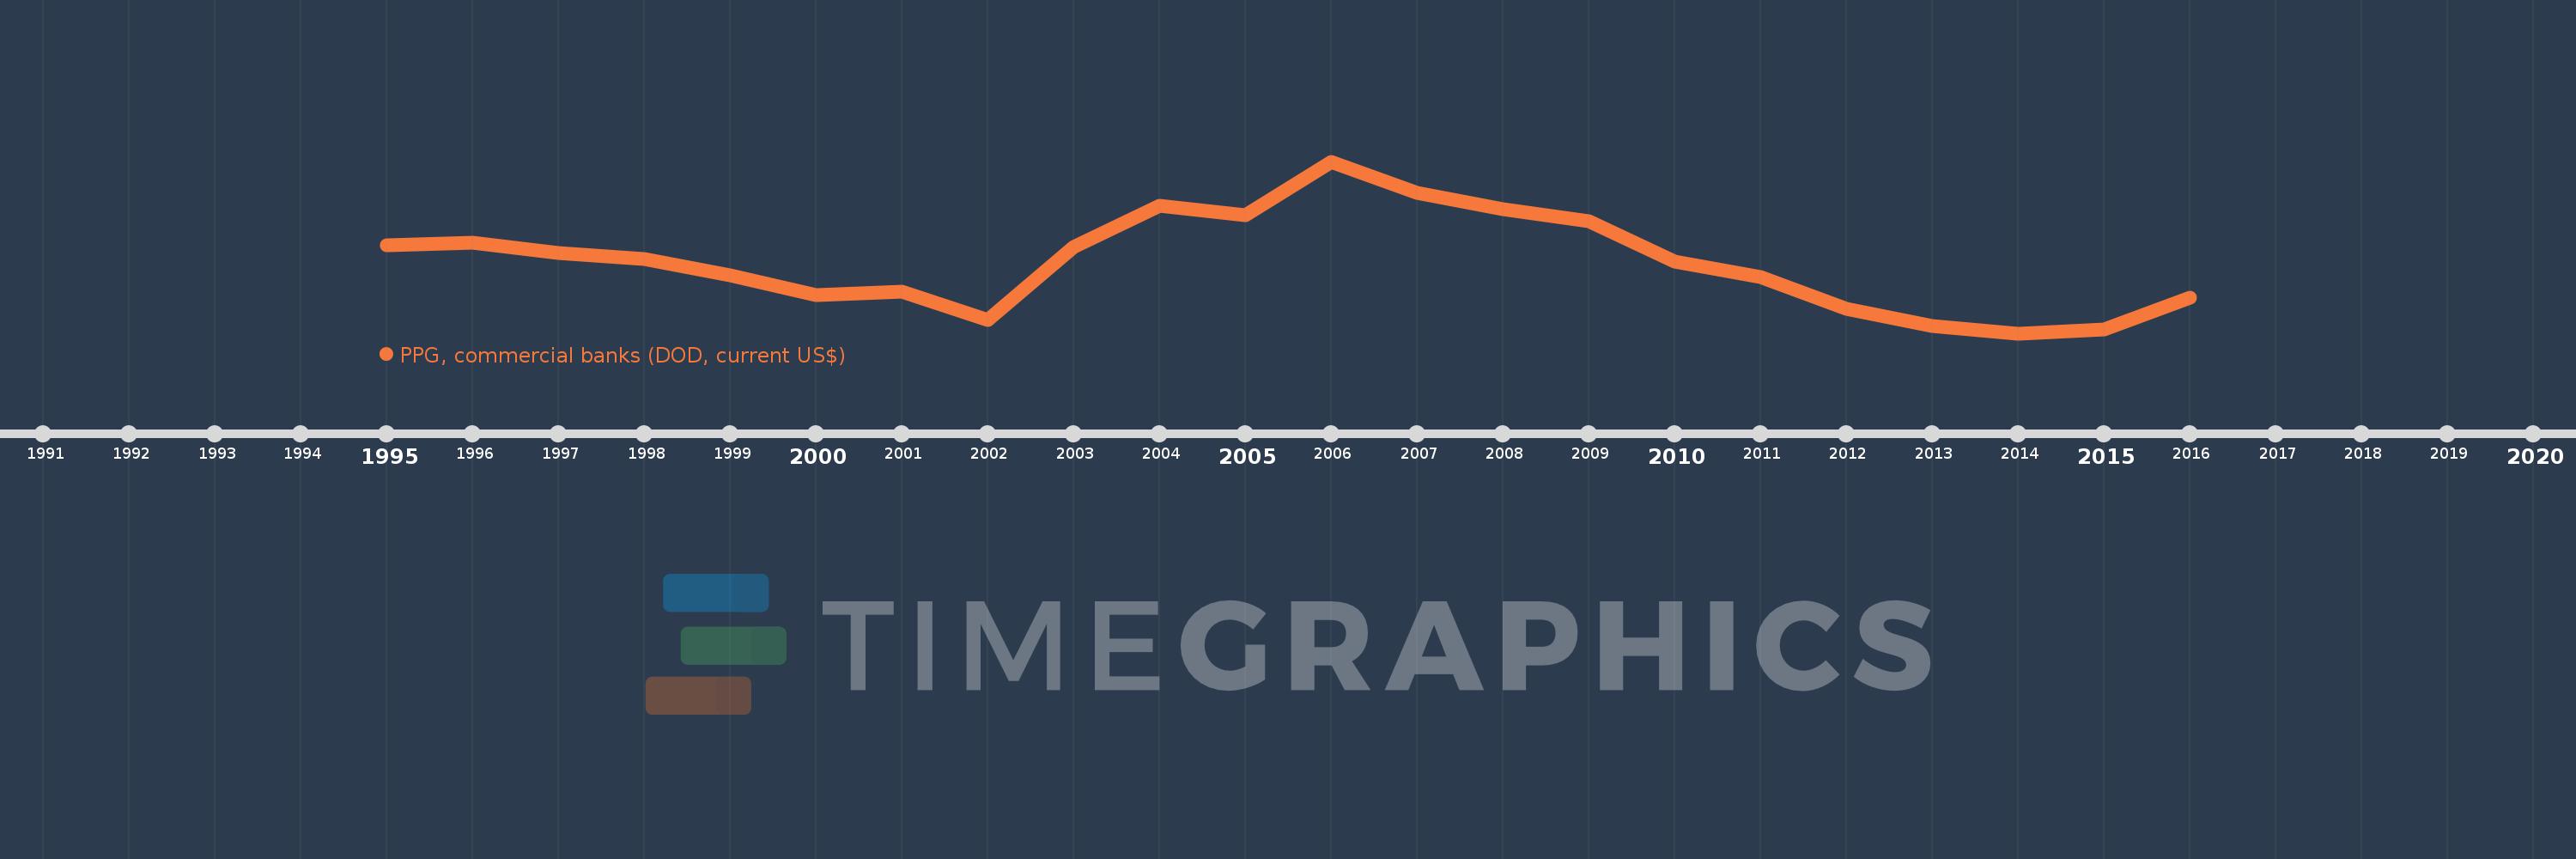
PPG, commercial banks (DOD, current US$)
2016,2015,2014,2013,2012,2011,2010,2009,2008,2007,2006,2005,2004,2003,2002,2001,2000,1999,1998,1997,1996,1995
This statistics in other country:
Timeline:
This timeline shows a graph from 1995 to 2016 of South Africa. No data until 1994. Number of actual observations by date: 22.
Source name:
World Development Indicators
Source organization:
World Bank, International Debt Statistics.
Categories, topics:
External Debt
Last updated:
apr 23, 2017
Indicators value changes by year
Minimum:
297.595 mln
jan 1, 2014
Maximum:
7.271 bln
jan 1, 2006
At the date of observation
Value
Absolute change
Change from previous value
jan 1, 1995
3.867 bln
+3.867 bln
0.0%
jan 1, 1996
3.978 bln
+110.84 mln
2.87%
jan 1, 1997
3.563 bln
-415.288 mln
-10.44%
jan 1, 1998
3.327 bln
-236.059 mln
-6.63%
jan 1, 1999
2.638 bln
-688.573 mln
-20.7%
jan 1, 2000
1.842 bln
-795.718 mln
-30.16%
jan 1, 2001
1.973 bln
+130.514 mln
7.08%
jan 1, 2002
838.994 mln
-1.134 bln
-57.47%
jan 1, 2003
3.813 bln
+2.974 bln
354.45%
jan 1, 2004
5.487 bln
+1.674 bln
43.91%
jan 1, 2005
5.081 bln
-405.976 mln
-7.4%
jan 1, 2006
7.271 bln
+2.19 bln
43.1%
jan 1, 2007
6.009 bln
-1.262 bln
-17.36%
jan 1, 2008
5.327 bln
-681.366 mln
-11.34%
jan 1, 2009
4.849 bln
-477.819 mln
-8.97%
jan 1, 2010
3.217 bln
-1.633 bln
-33.67%
jan 1, 2011
2.588 bln
-628.536 mln
-19.54%
jan 1, 2012
1.305 bln
-1.283 bln
-49.57%
jan 1, 2013
586.669 mln
-718.666 mln
-55.06%
jan 1, 2014
297.595 mln
-289.074 mln
-49.27%
jan 1, 2015
454.985 mln
+157.39 mln
52.89%
jan 1, 2016
1.747 bln
+1.292 bln
284.07%
Ranking of countries by current statistics by years


Comments: