29
/
en
AIzaSyAYiBZKx7MnpbEhh9jyipgxe19OcubqV5w
April 1, 2024
245451
South Africa
ZAF
true
2
1
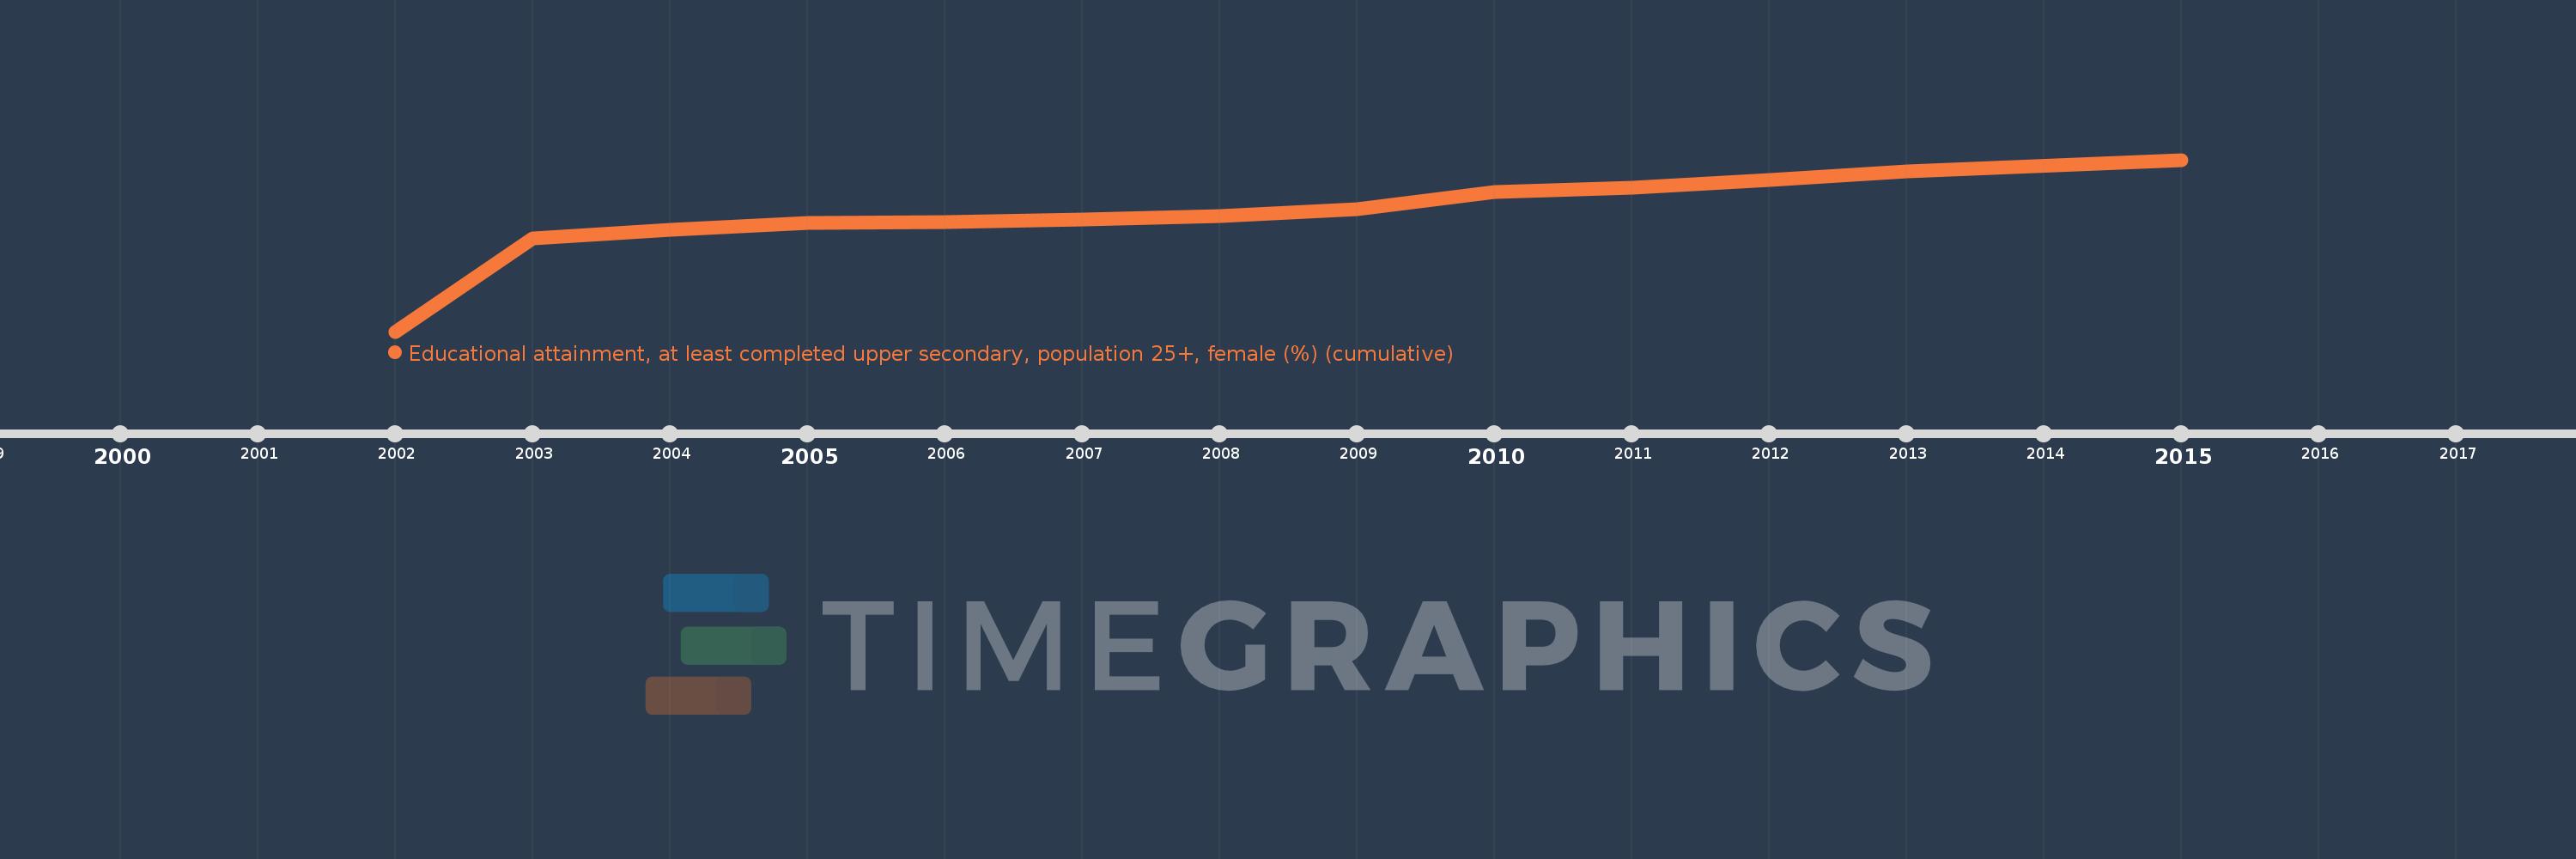
Educational attainment, at least completed upper secondary, population 25+, female (%) (cumulative)
2015,2013,2012,2011,2010,2009,2008,2007,2006,2005,2004,2003,2002
This statistics in other country:
Timeline:
This timeline shows a graph from 2002 to 2015 of South Africa. No data until 2001. Number of actual observations by date: 13.
Source name:
World Development Indicators
Source organization:
United Nations Educational, Scientific, and Cultural Organization (UNESCO) Institute for Statistics.
Categories, topics:
Education, Gender
Last updated:
apr 23, 2017
Indicators value changes by year
Maximum:
61.584
jan 1, 2015
At the date of observation
Value
Absolute change
Change from previous value
jan 1, 2002
25.36
+25.36
0.0%
jan 1, 2003
45.026
+19.667
77.55%
jan 1, 2004
46.737
+1.71
3.8%
jan 1, 2005
48.268
+1.531
3.28%
jan 1, 2006
48.388
+0.12
0.25%
jan 1, 2007
48.949
+0.561
1.16%
jan 1, 2008
49.685
+0.736
1.5%
jan 1, 2009
51.12
+1.434
2.89%
jan 1, 2010
54.735
+3.615
7.07%
jan 1, 2011
55.635
+0.9
1.64%
jan 1, 2012
57.378
+1.743
3.13%
jan 1, 2013
59.112
+1.734
3.02%
jan 1, 2015
61.584
+2.471
4.18%
Ranking of countries by current statistics by years


Comments: