29
/
en
AIzaSyAYiBZKx7MnpbEhh9jyipgxe19OcubqV5w
April 1, 2024
245445
South Africa
ZAF
true
2
1
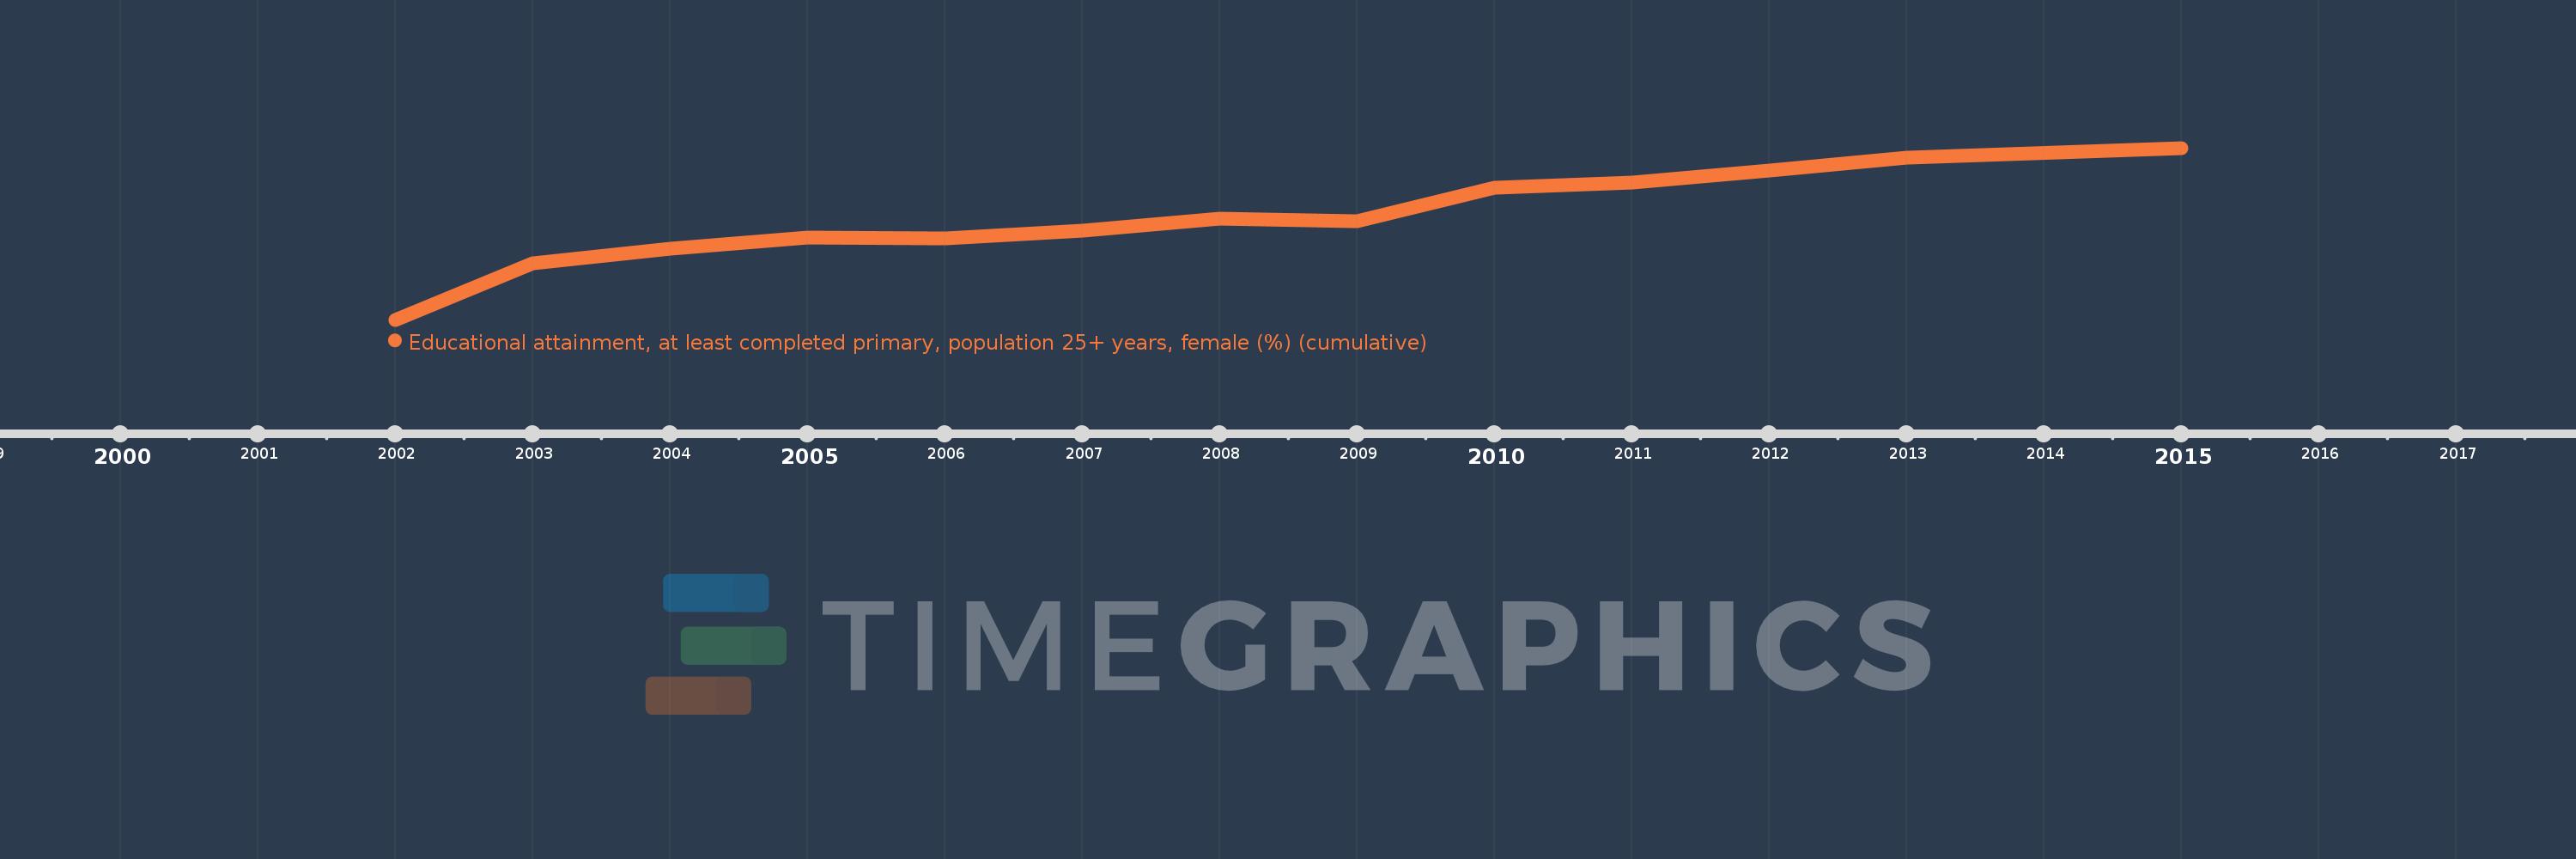
Educational attainment, at least completed primary, population 25+ years, female (%) (cumulative)
2015,2013,2012,2011,2010,2009,2008,2007,2006,2005,2004,2003,2002
This statistics in other country:
Timeline:
This timeline shows a graph from 2002 to 2015 of South Africa. No data until 2001. Number of actual observations by date: 13.
Source name:
World Development Indicators
Source organization:
United Nations Educational, Scientific, and Cultural Organization (UNESCO) Institute for Statistics.
Categories, topics:
Education, Gender
Last updated:
apr 23, 2017
Indicators value changes by year
Minimum:
60.324
jan 1, 2002
Maximum:
80.613
jan 1, 2015
At the date of observation
Value
Absolute change
Change from previous value
jan 1, 2002
60.324
+60.324
0.0%
jan 1, 2003
67.035
+6.711
11.12%
jan 1, 2004
68.68
+1.645
2.45%
jan 1, 2005
69.994
+1.314
1.91%
jan 1, 2006
69.979
-0.016
-0.02%
jan 1, 2007
70.861
+0.882
1.26%
jan 1, 2008
72.306
+1.446
2.04%
jan 1, 2009
71.956
-0.35
-0.48%
jan 1, 2010
75.868
+3.911
5.44%
jan 1, 2011
76.549
+0.681
0.9%
jan 1, 2012
77.924
+1.375
1.8%
jan 1, 2013
79.507
+1.583
2.03%
jan 1, 2015
80.613
+1.106
1.39%
Ranking of countries by current statistics by years


Comments: