29
/
en
AIzaSyAYiBZKx7MnpbEhh9jyipgxe19OcubqV5w
April 1, 2024
245192
South Africa
ZAF
true
2
1
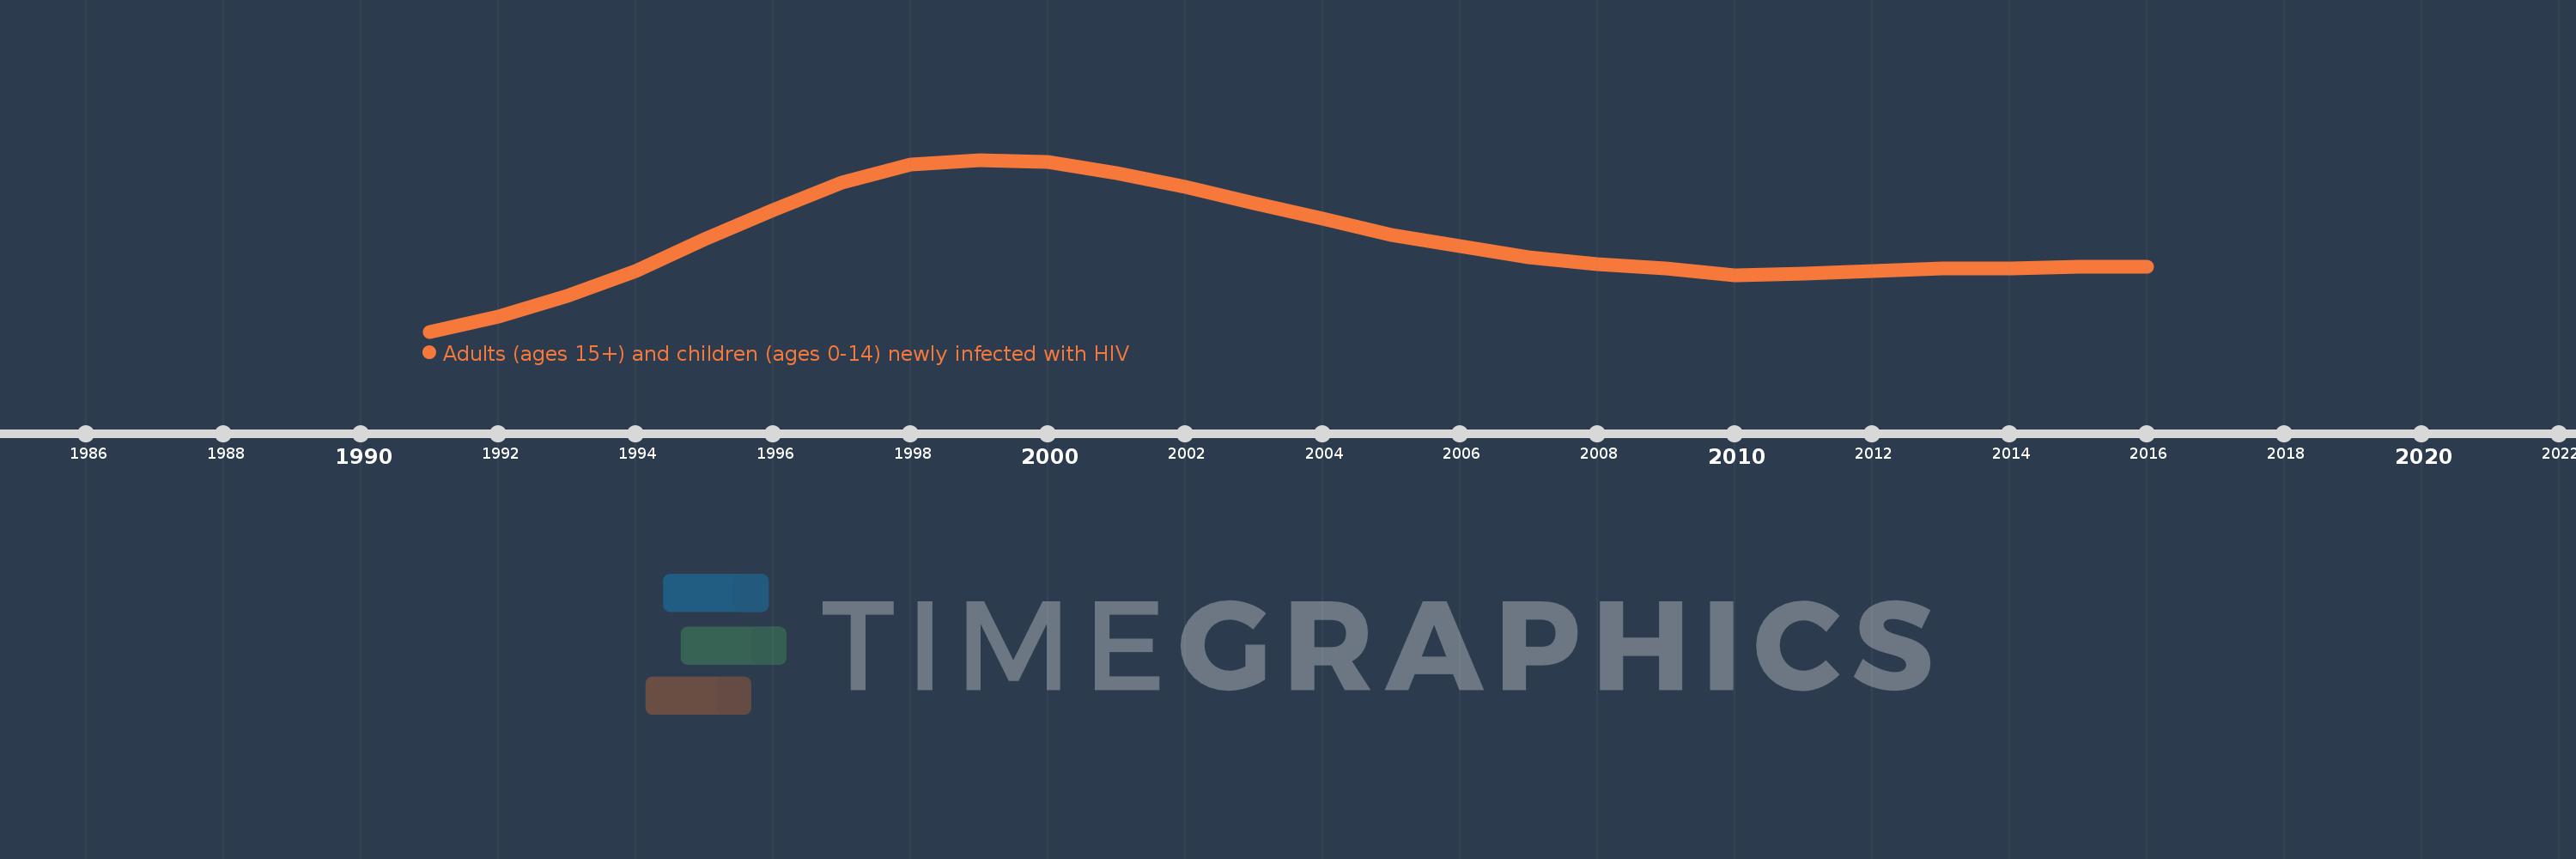
Adults (ages 15+) and children (ages 0-14) newly infected with HIV
2016,2015,2014,2013,2012,2011,2010,2009,2008,2007,2006,2005,2004,2003,2002,2001,2000,1999,1998,1997,1996,1995,1994,1993,1992,1991
This statistics in other country:
Timeline:
This timeline shows a graph from 1991 to 2016 of South Africa. No data until 1990. Number of actual observations by date: 26.
Source name:
World Development Indicators
Source organization:
UNAIDS estimates.
Categories, topics:
Health
Last updated:
apr 23, 2017
Indicators value changes by year
Maximum:
850.0K
jan 1, 1999
At the date of observation
Value
Absolute change
Change from previous value
jan 1, 1991
94.0K
+94.0K
0.0%
jan 1, 1992
160.0K
+66.0K
70.21%
jan 1, 1993
250.0K
+90.0K
56.25%
jan 1, 1994
360.0K
+110.0K
44.0%
jan 1, 1995
500.0K
+140.0K
38.89%
jan 1, 1996
630.0K
+130.0K
26.0%
jan 1, 1997
750.0K
+120.0K
19.05%
jan 1, 1998
830.0K
+80.0K
10.67%
jan 1, 1999
850.0K
+20.0K
2.41%
jan 1, 2000
840.0K
-10.0K
-1.18%
jan 1, 2001
790.0K
-50.0K
-5.95%
jan 1, 2002
730.0K
-60.0K
-7.59%
jan 1, 2003
660.0K
-70.0K
-9.59%
jan 1, 2004
590.0K
-70.0K
-10.61%
jan 1, 2005
520.0K
-70.0K
-11.86%
jan 1, 2006
470.0K
-50.0K
-9.62%
jan 1, 2007
420.0K
-50.0K
-10.64%
jan 1, 2008
390.0K
-30.0K
-7.14%
jan 1, 2009
370.0K
-20.0K
-5.13%
jan 1, 2010
340.0K
-30.0K
-8.11%
jan 1, 2011
350.0K
+10.0K
2.94%
jan 1, 2012
360.0K
+10.0K
2.86%
jan 1, 2013
370.0K
+10.0K
2.78%
jan 1, 2014
370.0K
0.0
0.0%
jan 1, 2015
380.0K
+10.0K
2.7%
jan 1, 2016
380.0K
0.0
0.0%
Ranking of countries by current statistics by years


Comments: