29
/
en
AIzaSyAYiBZKx7MnpbEhh9jyipgxe19OcubqV5w
April 1, 2024
242674
Slovenia
SVN
true
2
1
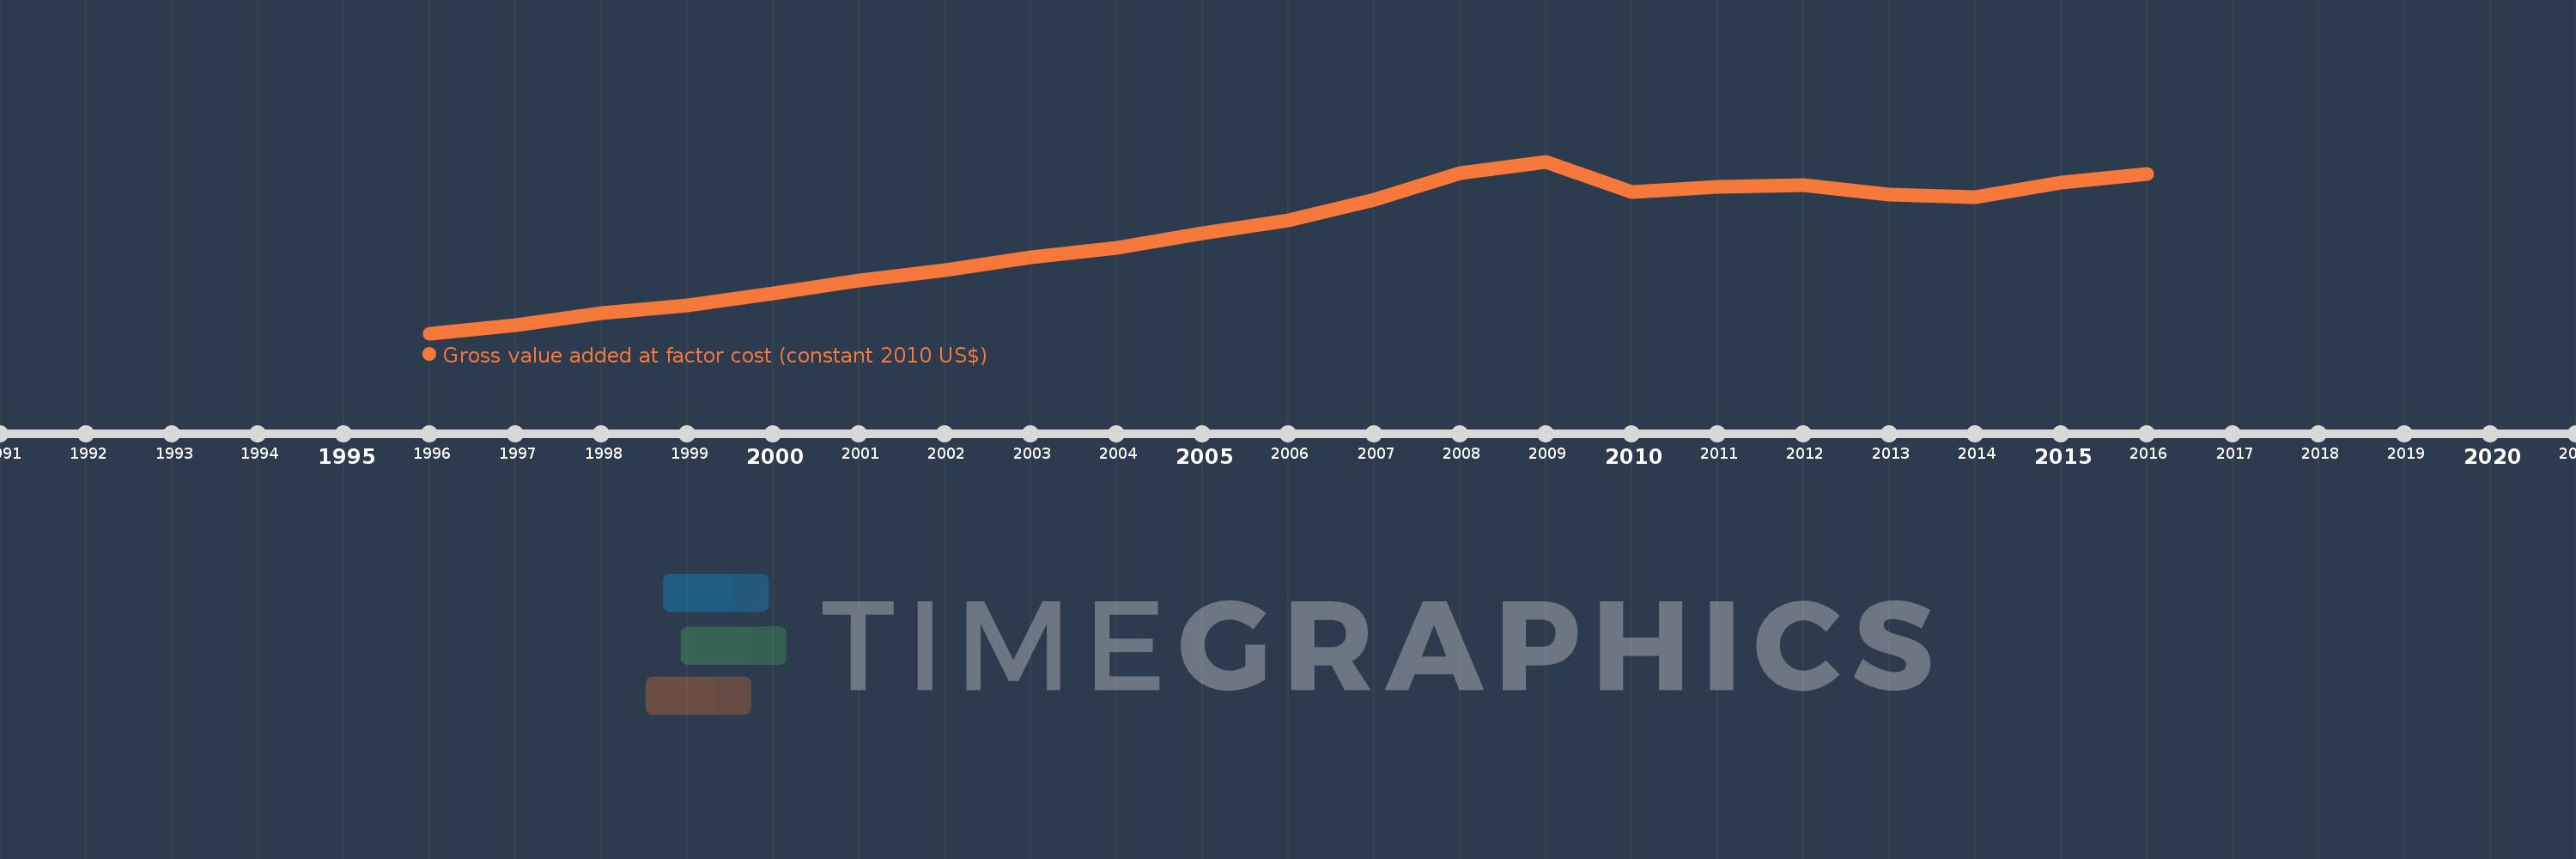
Gross value added at factor cost (constant 2010 US$)
2016,2015,2014,2013,2012,2011,2010,2009,2008,2007,2006,2005,2004,2003,2002,2001,2000,1999,1998,1997,1996
This statistics in other country:
AfghanistanAlbaniaAlgeriaAndorraAntigua and BarbudaArgentinaArmeniaArubaAustraliaAustriaAzerbaijanBahamas, TheBangladeshBarbadosBelarusBelgiumBelizeBeninBermudaBhutanBoliviaBosnia and HerzegovinaBotswanaBrazilBulgariaBurkina FasoBurundiCabo VerdeCambodiaCameroonCanadaCaribbean small statesCentral African RepublicCentral Europe and the BalticsChadChileColombiaCongo, Dem. Rep.Costa RicaCroatiaCubaCyprusCzech RepublicDenmarkDominicaDominican RepublicEarly-demographic dividendEcuadorEgypt, Arab Rep.El SalvadorEquatorial GuineaEstoniaEthiopiaEuro areaEurope & Central AsiaEurope & Central Asia (excluding high income)Europe & Central Asia (IDA & IBRD countries)European UnionFaroe IslandsFijiFinlandFranceGabonGambia, TheGeorgiaGermanyGhanaGreeceGrenadaGuatemalaGuineaGuinea-BissauGuyanaHeavily indebted poor countries (HIPC)High incomeHondurasHong Kong SAR, ChinaHungaryIcelandIDA blendIDA onlyIDA totalIndiaIndonesiaIran, Islamic Rep.IrelandItalyJamaicaJapanJordanKazakhstanKenyaKiribatiKorea, Rep.KosovoKuwaitKyrgyz RepublicLao PDRLatin America & Caribbean Latin America & Caribbean (excluding high income)Latin America & the Caribbean (IDA & IBRD countries)LatviaLeast developed countries: UN classificationLebanonLesothoLiechtensteinLithuaniaLow incomeLower middle incomeLuxembourgMacao SAR, ChinaMacedonia, FYRMadagascarMalawiMaldivesMaliMaltaMarshall IslandsMauritaniaMauritiusMexicoMicronesia, Fed. Sts.Middle East & North Africa (excluding high income)Middle East & North Africa (IDA & IBRD countries)MoldovaMongoliaMontenegroMoroccoMozambiqueNamibiaNepalNetherlandsNew ZealandNicaraguaNigeriaNorth AmericaNorwayOECD membersPacific island small statesPakistanPalauPanamaParaguayPeruPolandPortugalPost-demographic dividendPre-demographic dividendRomaniaRussian FederationRwandaSao Tome and PrincipeSenegalSerbiaSeychellesSierra LeoneSingaporeSlovak RepublicSloveniaSouth AfricaSouth AsiaSouth Asia (IDA & IBRD)SpainSri LankaSt. Kitts and NevisSt. LuciaSt. Vincent and the GrenadinesSub-Saharan Africa Sub-Saharan Africa (excluding high income)Sub-Saharan Africa (IDA & IBRD countries)SudanSurinameSwazilandSwedenSwitzerlandTajikistanTanzaniaThailandTimor-LesteTongaTrinidad and TobagoTunisiaTurkeyTurkmenistanTuvaluUgandaUkraineUnited KingdomUnited StatesUruguayUzbekistanVanuatuVenezuela, RBVietnamWest Bank and GazaWorldZambiaZimbabwe Timeline:
This timeline shows a graph from 1996 to 2016 of Slovenia. No data until 1995. Number of actual observations by date: 21.
Source name:
World Development Indicators
Source organization:
World Bank national accounts data, and OECD National Accounts data files.
Categories, topics:
Economy & Growth
Last updated:
apr 23, 2017
Indicators value changes by year
Minimum:
25.934 bln
jan 1, 1996
Maximum:
44.561 bln
jan 1, 2009
At the date of observation
Value
Absolute change
Change from previous value
jan 1, 1996
25.934 bln
+25.934 bln
0.0%
jan 1, 1997
26.792 bln
+858.55 mln
3.31%
jan 1, 1998
28.106 bln
+1.314 bln
4.9%
jan 1, 1999
28.945 bln
+839.254 mln
2.99%
jan 1, 2000
30.287 bln
+1.342 bln
4.64%
jan 1, 2001
31.693 bln
+1.406 bln
4.64%
jan 1, 2002
32.821 bln
+1.128 bln
3.56%
jan 1, 2003
34.214 bln
+1.393 bln
4.24%
jan 1, 2004
35.235 bln
+1.02 bln
2.98%
jan 1, 2005
36.764 bln
+1.53 bln
4.34%
jan 1, 2006
38.182 bln
+1.418 bln
3.86%
jan 1, 2007
40.421 bln
+2.239 bln
5.86%
jan 1, 2008
43.297 bln
+2.877 bln
7.12%
jan 1, 2009
44.561 bln
+1.264 bln
2.92%
jan 1, 2010
41.287 bln
-3.274 bln
-7.35%
jan 1, 2011
41.831 bln
+544.73 mln
1.32%
jan 1, 2012
41.97 bln
+138.391 mln
0.33%
jan 1, 2013
40.984 bln
-985.344 mln
-2.35%
jan 1, 2014
40.672 bln
-312.572 mln
-0.76%
jan 1, 2015
42.237 bln
+1.565 bln
3.85%
jan 1, 2016
43.199 bln
+962.196 mln
2.28%
Ranking of countries by current statistics by years


Comments: