29
/
en
AIzaSyAYiBZKx7MnpbEhh9jyipgxe19OcubqV5w
April 1, 2024
242609
Slovenia
SVN
true
2
1
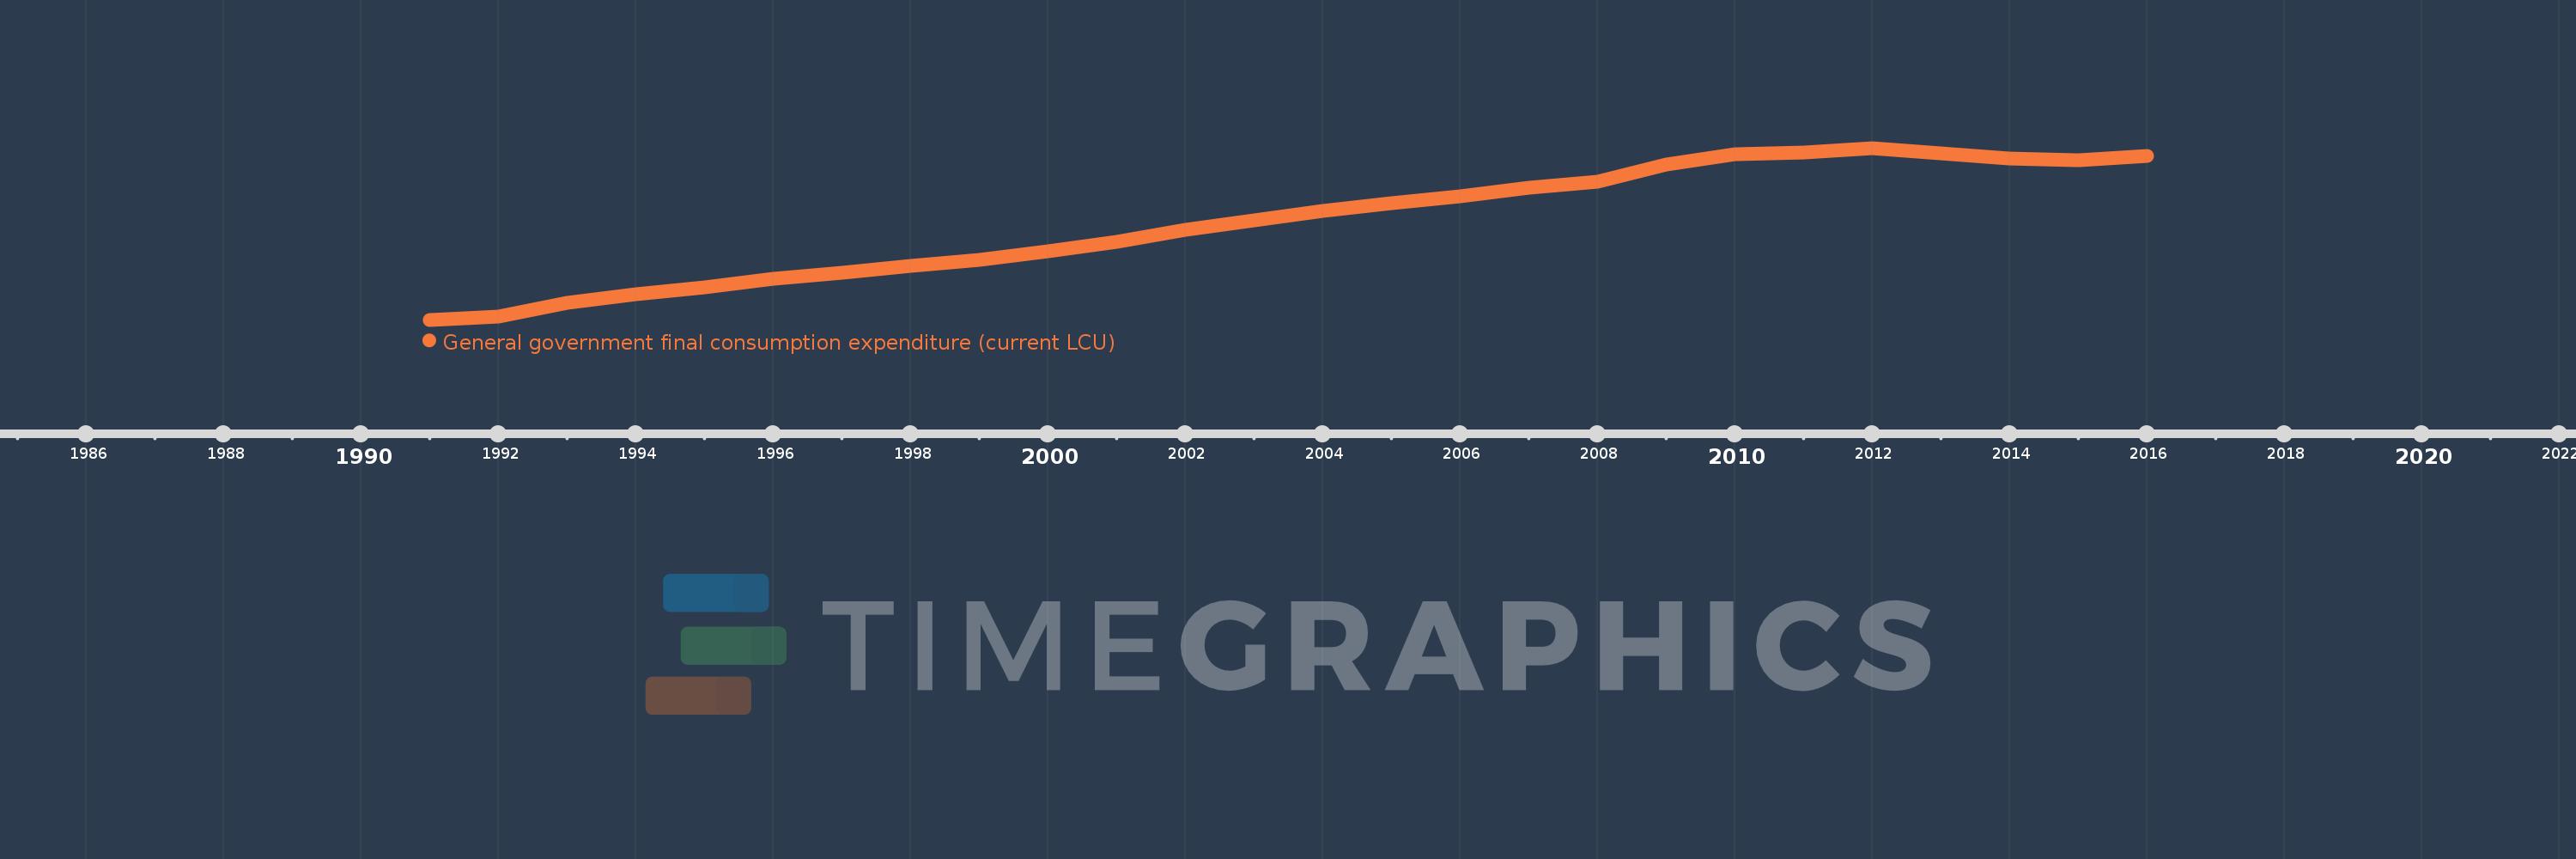
General government final consumption expenditure (current LCU)
2016,2015,2014,2013,2012,2011,2010,2009,2008,2007,2006,2005,2004,2003,2002,2001,2000,1999,1998,1997,1996,1995,1994,1993,1992,1991
This statistics in other country:
AfghanistanAlbaniaAlgeriaAngolaAntigua and BarbudaArgentinaArmeniaArubaAustraliaAustriaAzerbaijanBahamas, TheBahrainBangladeshBarbadosBelarusBelgiumBelizeBeninBermudaBhutanBoliviaBosnia and HerzegovinaBotswanaBrazilBrunei DarussalamBulgariaBurkina FasoBurundiCabo VerdeCambodiaCameroonCanadaCentral African RepublicChadChileChinaColombiaComorosCongo, Dem. Rep.Congo, Rep.Costa RicaCote d'IvoireCroatiaCubaCyprusCzech RepublicDenmarkDjiboutiDominicaDominican RepublicEcuadorEgypt, Arab Rep.El SalvadorEquatorial GuineaEritreaEstoniaEthiopiaFaroe IslandsFijiFinlandFranceFrench PolynesiaGabonGambia, TheGeorgiaGermanyGhanaGreeceGrenadaGuatemalaGuineaGuinea-BissauGuyanaHaitiHondurasHong Kong SAR, ChinaHungaryIcelandIndiaIndonesiaIran, Islamic Rep.IraqIrelandIsraelItalyJamaicaJapanJordanKazakhstanKenyaKiribatiKorea, Rep.KosovoKuwaitKyrgyz RepublicLao PDRLatviaLebanonLesothoLiberiaLibyaLithuaniaLuxembourgMacao SAR, ChinaMacedonia, FYRMadagascarMalawiMalaysiaMaldivesMaliMaltaMauritaniaMauritiusMexicoMicronesia, Fed. Sts.MoldovaMongoliaMontenegroMoroccoMozambiqueNamibiaNepalNetherlandsNew CaledoniaNew ZealandNicaraguaNigerNigeriaNorwayOmanPakistanPanamaPapua New GuineaParaguayPeruPhilippinesPolandPortugalPuerto RicoQatarRomaniaRussian FederationRwandaSaudi ArabiaSenegalSerbiaSeychellesSierra LeoneSingaporeSlovak RepublicSloveniaSolomon IslandsSomaliaSouth AfricaSouth SudanSpainSri LankaSt. Kitts and NevisSt. LuciaSt. Vincent and the GrenadinesSudanSurinameSwazilandSwedenSwitzerlandSyrian Arab RepublicTajikistanTanzaniaThailandTimor-LesteTogoTongaTrinidad and TobagoTunisiaTurkeyTurkmenistanUgandaUkraineUnited Arab EmiratesUnited KingdomUnited StatesUruguayUzbekistanVanuatuVenezuela, RBVietnamWest Bank and GazaYemen, Rep.ZambiaZimbabwe Timeline:
This timeline shows a graph from 1991 to 2016 of Slovenia. No data until 1990. Number of actual observations by date: 26.
Source name:
World Development Indicators
Source organization:
World Bank national accounts data, and OECD National Accounts data files.
Categories, topics:
Economy & Growth
Last updated:
apr 23, 2017
Indicators value changes by year
Minimum:
141.366 mln
jan 1, 1991
Maximum:
7.537 bln
jan 1, 2012
At the date of observation
Value
Absolute change
Change from previous value
jan 1, 1991
141.366 mln
+141.366 mln
0.0%
jan 1, 1992
274.289 mln
+132.923 mln
94.03%
jan 1, 1993
855.003 mln
+580.713 mln
211.72%
jan 1, 1994
1.25 bln
+394.872 mln
46.18%
jan 1, 1995
1.546 bln
+296.073 mln
23.69%
jan 1, 1996
1.895 bln
+348.834 mln
22.56%
jan 1, 1997
2.164 bln
+269.702 mln
14.23%
jan 1, 1998
2.453 bln
+288.055 mln
13.31%
jan 1, 1999
2.719 bln
+266.805 mln
10.88%
jan 1, 2000
3.078 bln
+359.087 mln
13.2%
jan 1, 2001
3.498 bln
+419.304 mln
13.62%
jan 1, 2002
3.998 bln
+500.246 mln
14.3%
jan 1, 2003
4.411 bln
+413.433 mln
10.34%
jan 1, 2004
4.827 bln
+415.732 mln
9.42%
jan 1, 2005
5.165 bln
+337.766 mln
7.0%
jan 1, 2006
5.46 bln
+294.65 mln
5.7%
jan 1, 2007
5.819 bln
+359.202 mln
6.58%
jan 1, 2008
6.079 bln
+260.105 mln
4.47%
jan 1, 2009
6.841 bln
+762.084 mln
12.54%
jan 1, 2010
7.255 bln
+413.577 mln
6.05%
jan 1, 2011
7.353 bln
+98.738 mln
1.36%
jan 1, 2012
7.537 bln
+184.103 mln
2.5%
jan 1, 2013
7.296 bln
-241.056 mln
-3.2%
jan 1, 2014
7.072 bln
-224.053 mln
-3.07%
jan 1, 2015
7.0 bln
-72.579 mln
-1.03%
jan 1, 2016
7.204 bln
+203.888 mln
2.91%
Ranking of countries by current statistics by years


Comments: