29
/
en
AIzaSyAYiBZKx7MnpbEhh9jyipgxe19OcubqV5w
April 1, 2024
240936
Singapore
SGP
true
2
1
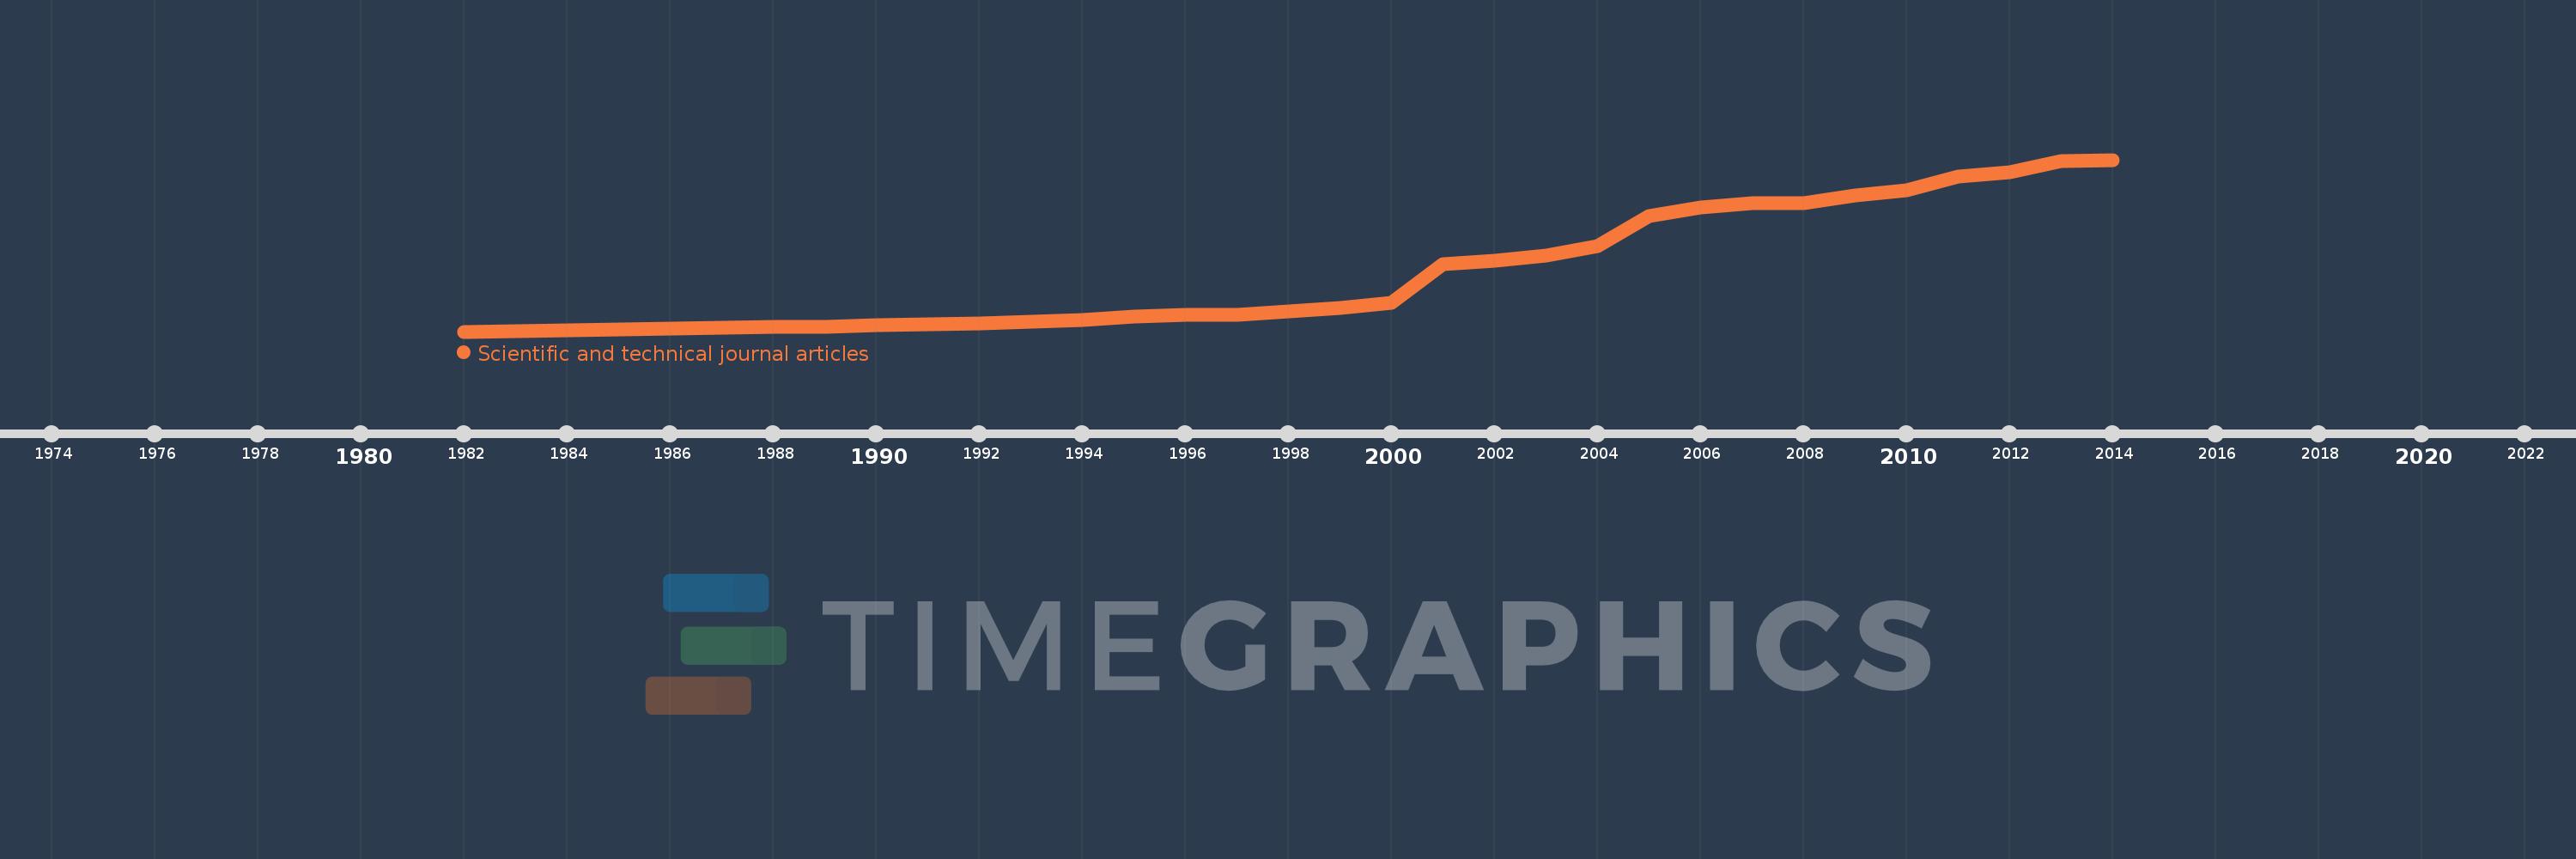
Scientific and technical journal articles
2014,2013,2012,2011,2010,2009,2008,2007,2006,2005,2004,2003,2002,2001,2000,1999,1998,1997,1996,1995,1994,1993,1992,1991,1990,1989,1988,1987,1986,1982
This statistics in other country:
AfghanistanAlbaniaAlgeriaAndorraAngolaAntigua and BarbudaArab WorldArgentinaArmeniaAustraliaAustriaAzerbaijanBahamas, TheBahrainBangladeshBarbadosBelarusBelgiumBelizeBeninBhutanBoliviaBosnia and HerzegovinaBotswanaBrazilBrunei DarussalamBulgariaBurkina FasoBurundiCabo VerdeCambodiaCameroonCanadaCaribbean small statesCentral African RepublicCentral Europe and the BalticsChadChileChinaColombiaComorosCongo, Dem. Rep.Congo, Rep.Costa RicaCote d'IvoireCroatiaCubaCyprusCzech RepublicDenmarkDjiboutiDominicaDominican RepublicEarly-demographic dividendEast Asia & PacificEast Asia & Pacific (excluding high income)East Asia & Pacific (IDA & IBRD countries)EcuadorEgypt, Arab Rep.El SalvadorEquatorial GuineaEritreaEstoniaEthiopiaEuro areaEurope & Central AsiaEurope & Central Asia (excluding high income)Europe & Central Asia (IDA & IBRD countries)European UnionFijiFinlandFragile and conflict affected situationsFranceGabonGambia, TheGeorgiaGermanyGhanaGreeceGrenadaGuatemalaGuineaGuinea-BissauGuyanaHaitiHeavily indebted poor countries (HIPC)High incomeHondurasHong Kong SAR, ChinaHungaryIBRD onlyIcelandIDA & IBRD totalIDA blendIDA onlyIDA totalIndiaIndonesiaIran, Islamic Rep.IraqIrelandIsraelItalyJamaicaJapanJordanKazakhstanKenyaKiribatiKorea, Dem. People’s Rep.Korea, Rep.KosovoKuwaitKyrgyz RepublicLao PDRLate-demographic dividendLatin America & Caribbean Latin America & Caribbean (excluding high income)Latin America & the Caribbean (IDA & IBRD countries)LatviaLeast developed countries: UN classificationLebanonLesothoLiberiaLibyaLiechtensteinLithuaniaLow & middle incomeLow incomeLower middle incomeLuxembourgMacedonia, FYRMadagascarMalawiMalaysiaMaldivesMaliMaltaMarshall IslandsMauritaniaMauritiusMexicoMicronesia, Fed. Sts.Middle East & North AfricaMiddle East & North Africa (excluding high income)Middle East & North Africa (IDA & IBRD countries)Middle incomeMoldovaMonacoMongoliaMontenegroMoroccoMozambiqueMyanmarNamibiaNauruNepalNetherlandsNew ZealandNicaraguaNigerNigeriaNorth AmericaNorwayOECD membersOmanOther small statesPacific island small statesPakistanPalauPanamaPapua New GuineaParaguayPeruPhilippinesPolandPortugalPost-demographic dividendPre-demographic dividendQatarRomaniaRussian FederationRwandaSamoaSan MarinoSao Tome and PrincipeSaudi ArabiaSenegalSerbiaSeychellesSierra LeoneSingaporeSlovak RepublicSloveniaSmall statesSolomon IslandsSomaliaSouth AfricaSouth AsiaSouth Asia (IDA & IBRD)SpainSri LankaSt. Kitts and NevisSt. LuciaSt. Vincent and the GrenadinesSub-Saharan Africa Sub-Saharan Africa (excluding high income)Sub-Saharan Africa (IDA & IBRD countries)SudanSurinameSwazilandSwedenSwitzerlandSyrian Arab RepublicTajikistanTanzaniaThailandTogoTongaTrinidad and TobagoTunisiaTurkeyTurkmenistanTuvaluUgandaUkraineUnited Arab EmiratesUnited KingdomUnited StatesUpper middle incomeUruguayUzbekistanVanuatuVenezuela, RBVietnamWest Bank and GazaWorldYemen, Rep.ZambiaZimbabwe Timeline:
This timeline shows a graph from 1982 to 2014 of Singapore. No data until 1981. Number of actual observations by date: 30.
Source name:
World Development Indicators
Source organization:
National Science Foundation, Science and Engineering Indicators.
Categories, topics:
Science & Technology
Last updated:
apr 23, 2017
Indicators value changes by year
Maximum:
10.659K
jan 1, 2014
At the date of observation
Value
Absolute change
Change from previous value
jan 1, 1982
124.0
+124.0
0.0%
jan 1, 1986
289.0
+165.0
133.06%
jan 1, 1987
358.0
+69.0
23.88%
jan 1, 1988
401.0
+43.0
12.01%
jan 1, 1989
410.0
+9.0
2.24%
jan 1, 1990
517.0
+107.0
26.1%
jan 1, 1991
572.0
+55.0
10.64%
jan 1, 1992
599.0
+27.0
4.72%
jan 1, 1993
755.0
+156.0
26.04%
jan 1, 1994
854.0
+99.0
13.11%
jan 1, 1995
1.022K
+168.0
19.67%
jan 1, 1996
1.141K
+119.4
11.68%
jan 1, 1997
1.141K
-0.2
-0.02%
jan 1, 1998
1.339K
+197.3
17.29%
jan 1, 1999
1.584K
+245.7
18.36%
jan 1, 2000
1.897K
+313.0
19.76%
jan 1, 2001
4.249K
+2.352K
123.96%
jan 1, 2002
4.496K
+246.6
5.8%
jan 1, 2003
4.779K
+283.0
6.3%
jan 1, 2004
5.343K
+564.2
11.81%
jan 1, 2005
7.232K
+1.889K
35.36%
jan 1, 2006
7.757K
+525.0
7.26%
jan 1, 2007
7.986K
+228.5
2.95%
jan 1, 2008
8.015K
+29.5
0.37%
jan 1, 2009
8.468K
+453.3
5.66%
jan 1, 2010
8.8K
+331.3
3.91%
jan 1, 2011
9.617K
+817.3
9.29%
jan 1, 2012
9.896K
+279.5
2.91%
jan 1, 2013
10.602K
+705.8
7.13%
jan 1, 2014
10.659K
+56.2
0.53%
Ranking of countries by current statistics by years


Comments: