29
/
en
AIzaSyAYiBZKx7MnpbEhh9jyipgxe19OcubqV5w
April 1, 2024
240373
Singapore
SGP
true
2
1
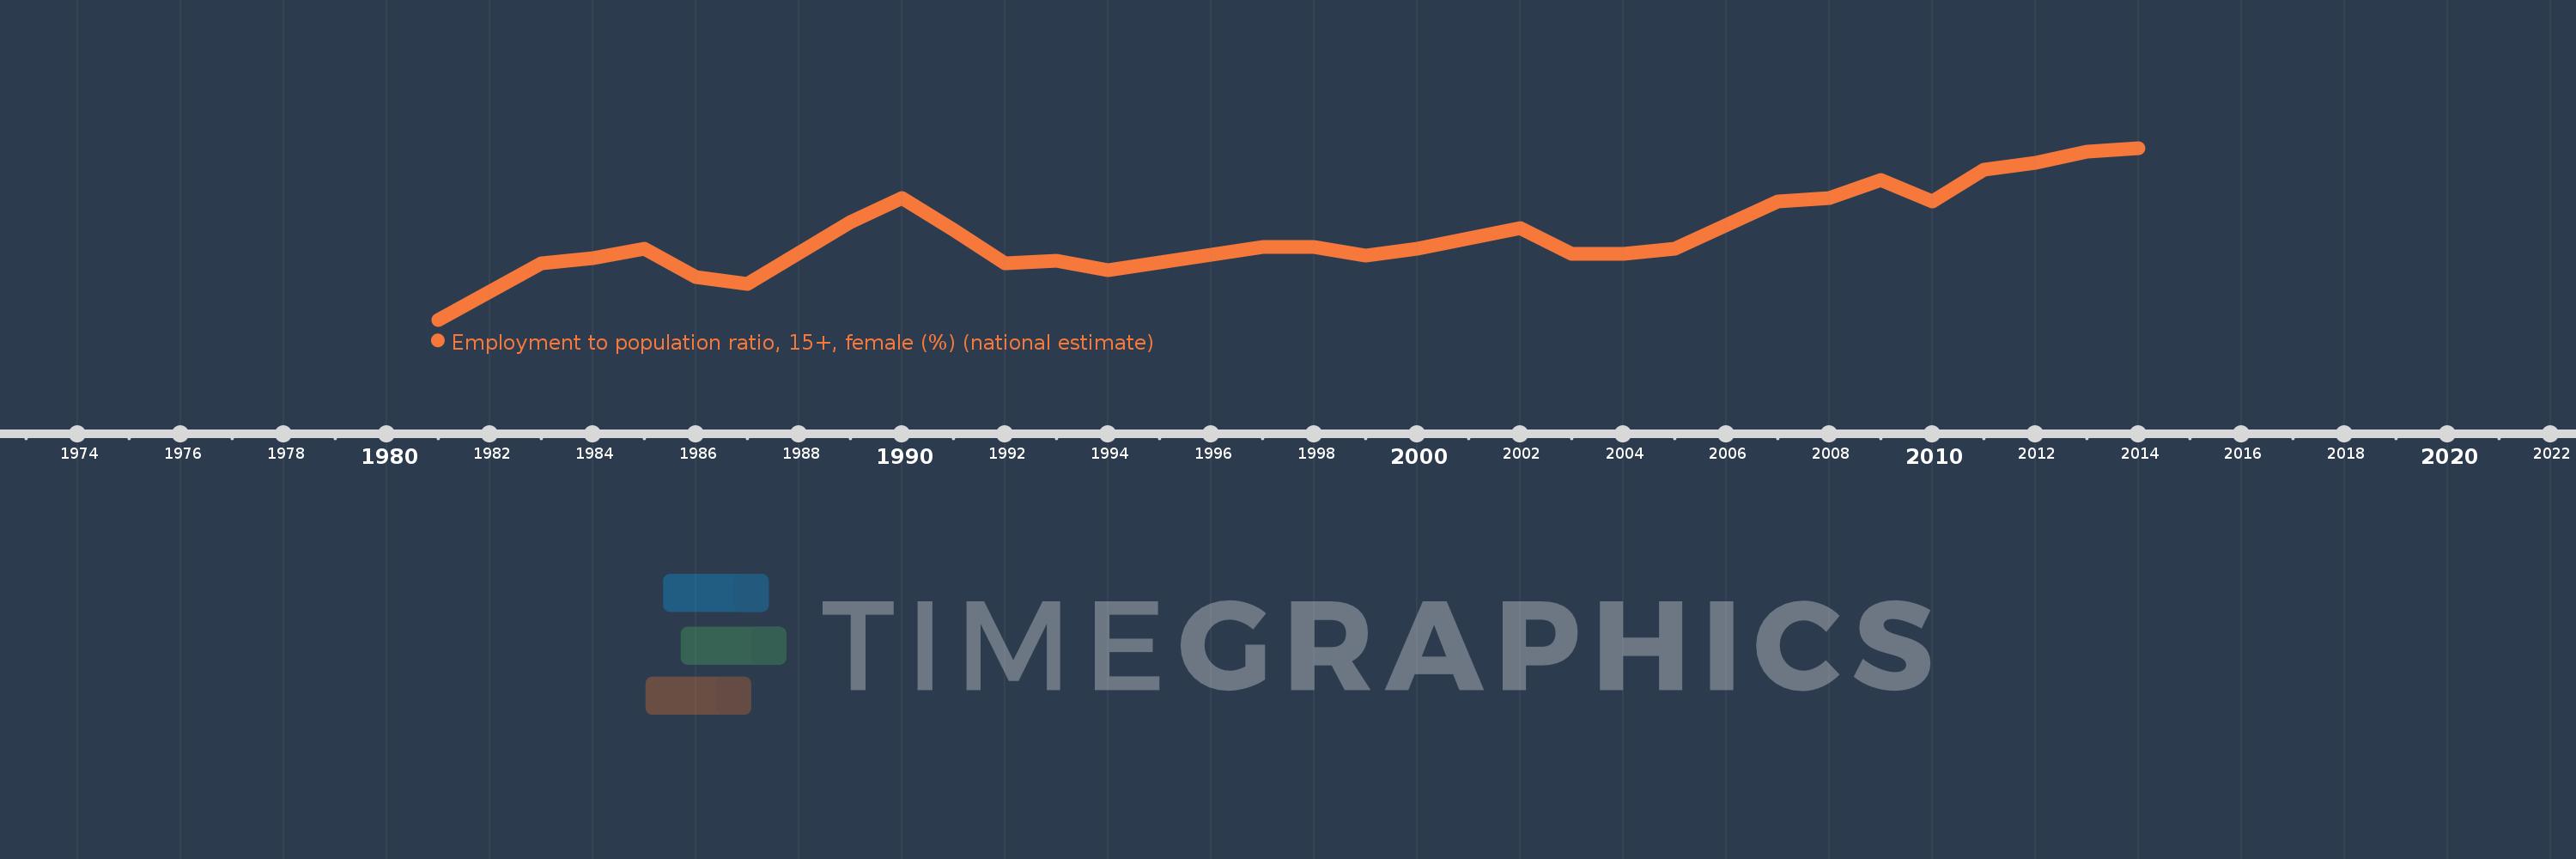
Employment to population ratio, 15+, female (%) (national estimate)
2014,2013,2012,2011,2010,2009,2008,2007,2005,2004,2003,2002,2000,1999,1998,1997,1995,1994,1993,1992,1991,1990,1989,1988,1987,1986,1985,1984,1983,1981
This statistics in other country:
AfghanistanAlbaniaAlgeriaAmerican SamoaAntigua and BarbudaArab WorldArgentinaArmeniaArubaAustraliaAustriaAzerbaijanBahamas, TheBahrainBangladeshBarbadosBelarusBelgiumBelizeBeninBermudaBhutanBoliviaBosnia and HerzegovinaBotswanaBrazilBritish Virgin IslandsBrunei DarussalamBulgariaBurkina FasoBurundiCambodiaCameroonCanadaCaribbean small statesCayman IslandsCentral Europe and the BalticsChadChileColombiaCongo, Dem. Rep.Congo, Rep.Costa RicaCroatiaCubaCyprusCzech RepublicDenmarkDjiboutiDominicaDominican RepublicEarly-demographic dividendEcuadorEgypt, Arab Rep.El SalvadorEstoniaEthiopiaEuro areaEurope & Central AsiaEurope & Central Asia (excluding high income)Europe & Central Asia (IDA & IBRD countries)European UnionFaroe IslandsFijiFinlandFranceFrench PolynesiaGabonGambia, TheGeorgiaGermanyGhanaGreeceGrenadaGuamGuatemalaGuineaGuyanaHaitiHigh incomeHondurasHong Kong SAR, ChinaHungaryIcelandIndiaIndonesiaIran, Islamic Rep.IraqIrelandIsle of ManIsraelItalyJamaicaJapanJordanKazakhstanKenyaKiribatiKorea, Rep.KosovoKuwaitKyrgyz RepublicLao PDRLatin America & Caribbean Latin America & Caribbean (excluding high income)Latin America & the Caribbean (IDA & IBRD countries)LatviaLebanonLesothoLiberiaLibyaLithuaniaLower middle incomeLuxembourgMacao SAR, ChinaMacedonia, FYRMadagascarMalawiMalaysiaMaldivesMaliMaltaMarshall IslandsMauritaniaMauritiusMexicoMiddle East & North AfricaMiddle East & North Africa (excluding high income)Middle East & North Africa (IDA & IBRD countries)MoldovaMonacoMongoliaMontenegroMoroccoMozambiqueNamibiaNepalNetherlandsNew CaledoniaNew ZealandNicaraguaNigerNigeriaNorth AmericaNorthern Mariana IslandsNorwayOECD membersOmanPakistanPanamaParaguayPeruPhilippinesPolandPortugalPost-demographic dividendPuerto RicoQatarRomaniaRussian FederationRwandaSamoaSan MarinoSao Tome and PrincipeSaudi ArabiaSenegalSerbiaSeychellesSierra LeoneSingaporeSlovak RepublicSloveniaSolomon IslandsSouth AfricaSouth AsiaSouth Asia (IDA & IBRD)South SudanSpainSri LankaSt. Kitts and NevisSt. LuciaSudanSurinameSwazilandSwedenSwitzerlandSyrian Arab RepublicTajikistanTanzaniaThailandTimor-LesteTogoTongaTrinidad and TobagoTunisiaTurkeyTuvaluUgandaUkraineUnited Arab EmiratesUnited KingdomUnited StatesUruguayVanuatuVenezuela, RBVietnamWest Bank and GazaYemen, Rep.ZambiaZimbabwe Timeline:
This timeline shows a graph from 1981 to 2014 of Singapore. No data until 1980. Number of actual observations by date: 30.
Source name:
World Development Indicators
Source organization:
International Labour Organization, Key Indicators of the Labour Market database.
Categories, topics:
Social Protection & Labor
Last updated:
apr 23, 2017
Indicators value changes by year
At the date of observation
Value
Absolute change
Change from previous value
jan 1, 1981
42.8
+42.8
0.0%
jan 1, 1983
47.0
+4.2
9.81%
jan 1, 1984
47.4
+0.4
0.85%
jan 1, 1985
48.1
+0.7
1.48%
jan 1, 1986
46.0
-2.1
-4.37%
jan 1, 1987
45.5
-0.5
-1.09%
jan 1, 1988
47.8
+2.3
5.05%
jan 1, 1989
50.1
+2.3
4.81%
jan 1, 1990
51.9
+1.8
3.59%
jan 1, 1991
49.5
-2.4
-4.62%
jan 1, 1992
47.0
-2.5
-5.05%
jan 1, 1993
47.2
+0.2
0.43%
jan 1, 1994
46.5
-0.7
-1.48%
jan 1, 1995
47.1
+0.6
1.29%
jan 1, 1997
48.2
+1.1
2.34%
jan 1, 1999
47.6
-0.6
-1.24%
jan 1, 2000
48.1
+0.5
1.05%
jan 1, 2002
49.6
+1.5
3.12%
jan 1, 2003
47.7
-1.9
-3.83%
jan 1, 2005
48.1
+0.4
0.84%
jan 1, 2007
51.6
+3.5
7.28%
jan 1, 2008
51.9
+0.3
0.58%
jan 1, 2009
53.2
+1.3
2.5%
jan 1, 2010
51.6
-1.6
-3.01%
jan 1, 2011
54.0
+2.4
4.65%
jan 1, 2012
54.5
+0.5
0.93%
jan 1, 2013
55.3
+0.8
1.47%
jan 1, 2014
55.6
+0.3
0.54%
Ranking of countries by current statistics by years


Comments: