29
/
en
AIzaSyAYiBZKx7MnpbEhh9jyipgxe19OcubqV5w
April 1, 2024
237851
Serbia
SRB
true
2
1
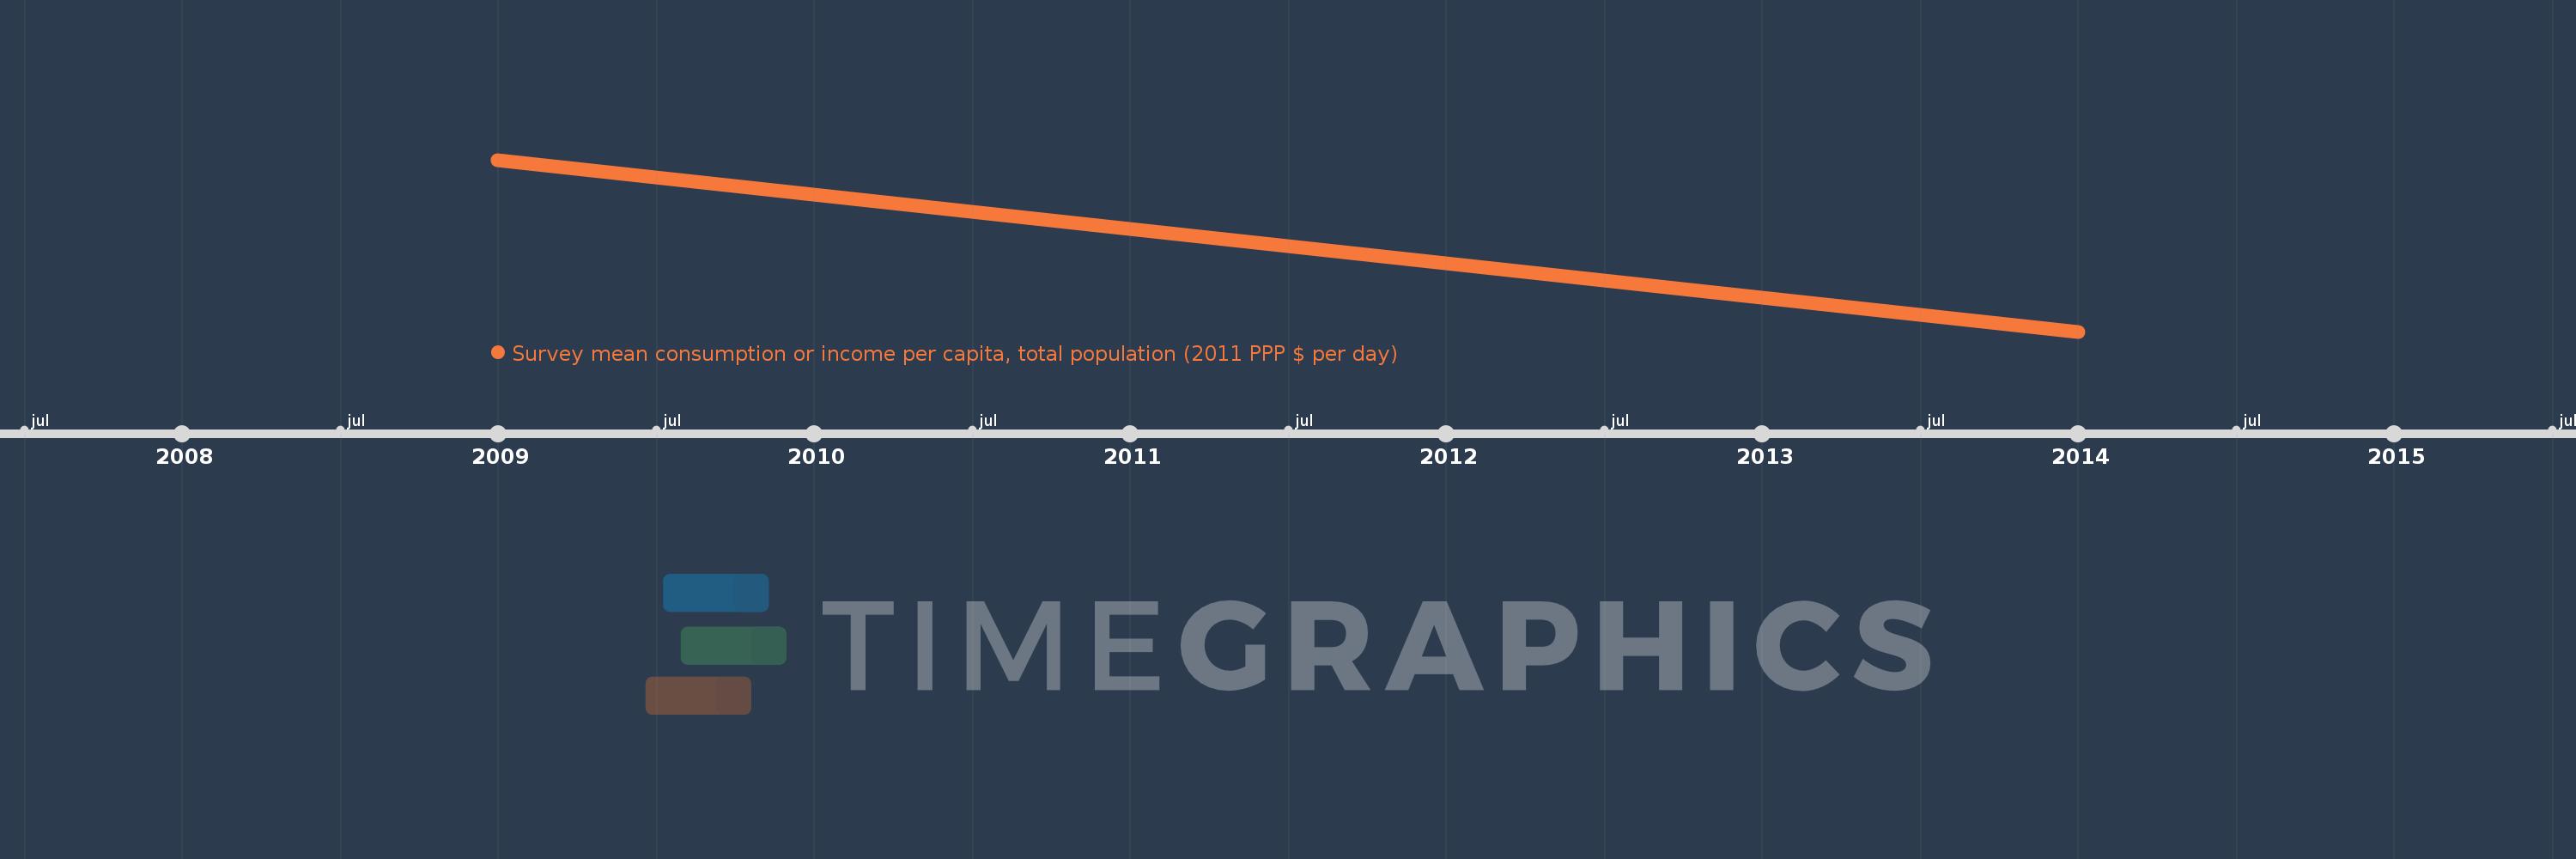
Survey mean consumption or income per capita, total population (2011 PPP $ per day)
2014,2009
This statistics in other country:
Timeline:
This timeline shows a graph from 2009 to 2014 of Serbia. No data until 2008. Number of actual observations by date: 2.
Source name:
World Development Indicators
Source organization:
World Bank, Global Database of Shared Prosperity (GDSP) circa 2008 - 2013 (http://www.worldbank.org/en/topic/poverty/brief/global-database-of-shared-prosperity).
Categories, topics:
Poverty
Last updated:
apr 23, 2017
Indicators value changes by year
At the date of observation
Value
Absolute change
Change from previous value
jan 1, 2009
13.44
+13.44
0.0%
jan 1, 2014
12.7
-0.74
-5.51%
Ranking of countries by current statistics by years


Comments: