29
/
en
AIzaSyAYiBZKx7MnpbEhh9jyipgxe19OcubqV5w
April 1, 2024
237741
Serbia
SRB
true
2
1
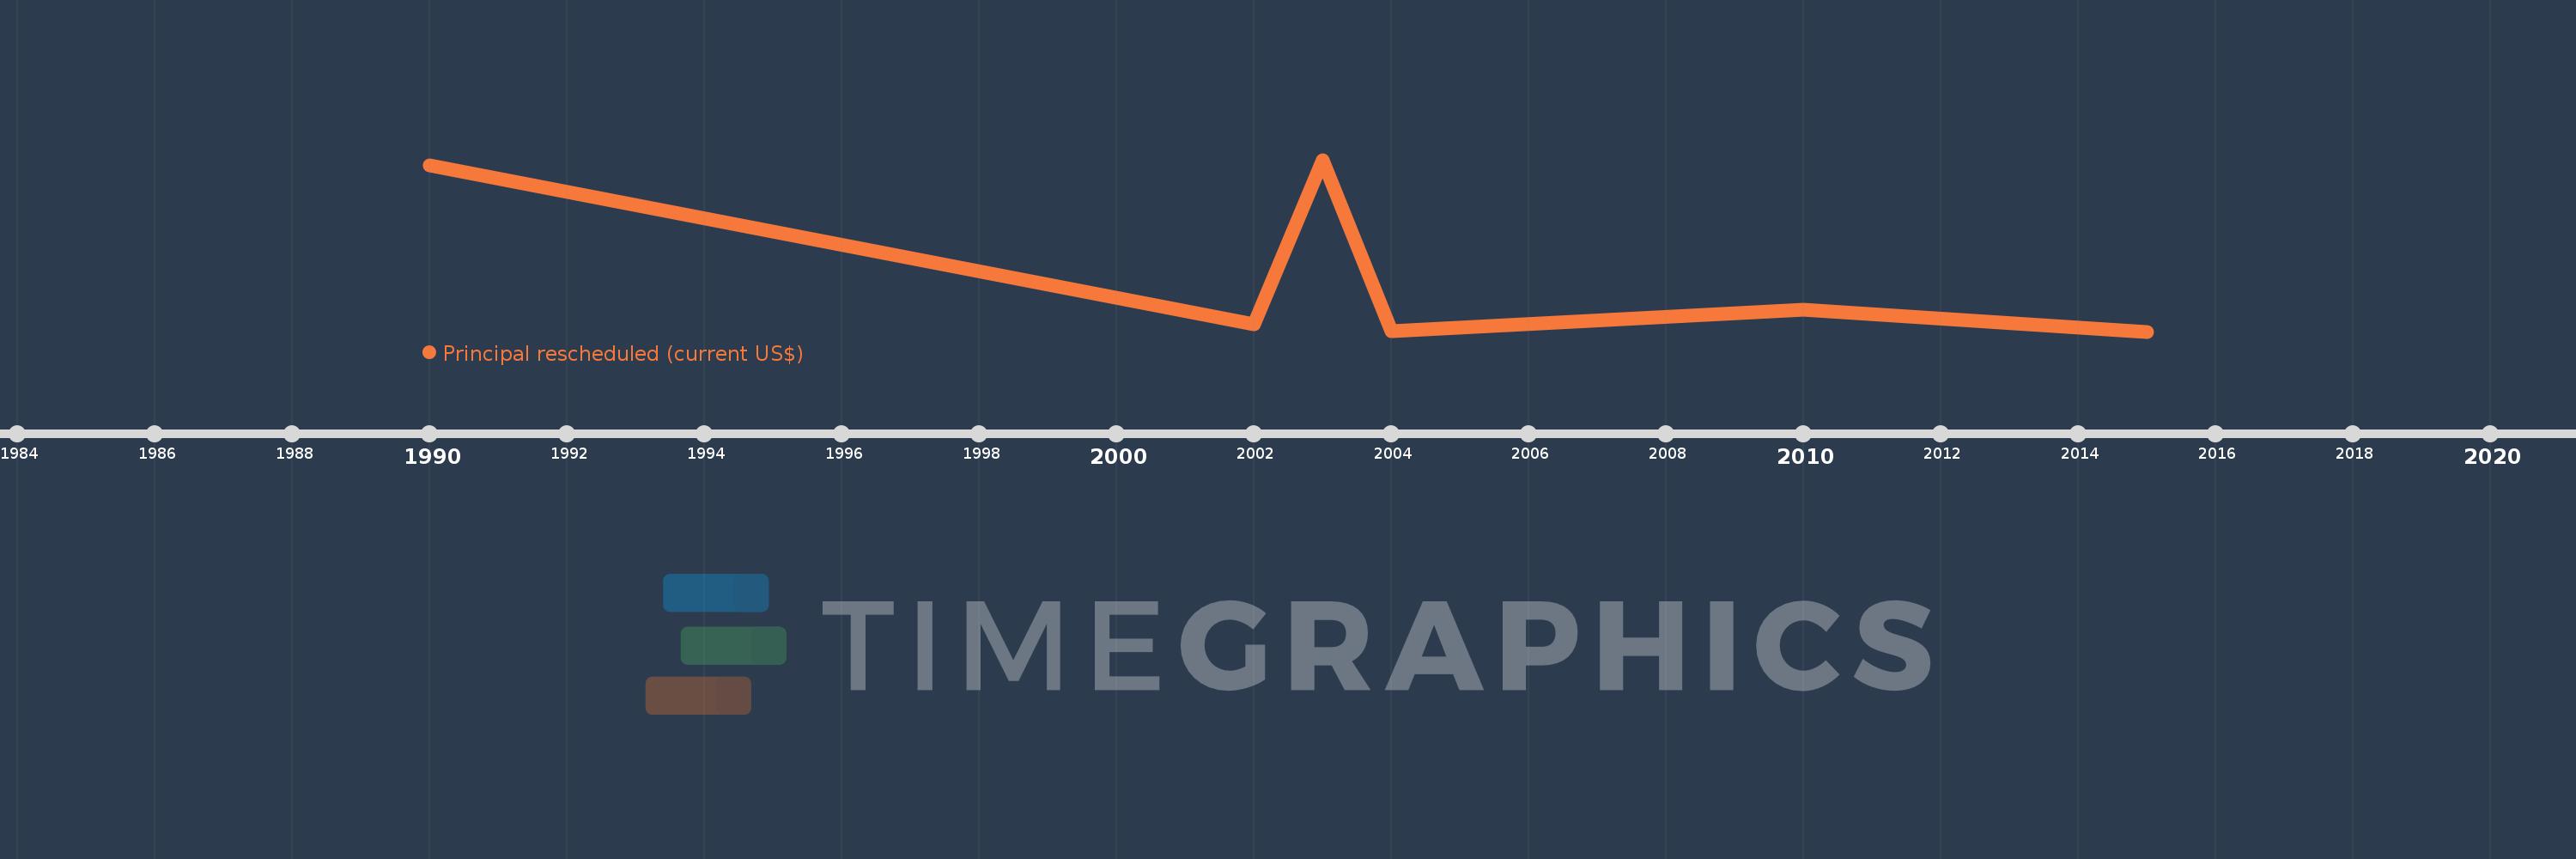
Principal rescheduled (current US$)
2015,2010,2004,2003,2002,1990
This statistics in other country:
Timeline:
This timeline shows a graph from 1990 to 2015 of Serbia. No data until 1989. Number of actual observations by date: 6.
Source name:
World Development Indicators
Source organization:
World Bank, International Debt Statistics.
Categories, topics:
External Debt
Last updated:
apr 23, 2017
Indicators value changes by year
Maximum:
1.287 bln
jan 1, 2003
At the date of observation
Value
Absolute change
Change from previous value
jan 1, 1990
1.248 bln
+1.248 bln
0.0%
jan 1, 2002
51.897 mln
-1.196 bln
-95.84%
jan 1, 2003
1.287 bln
+1.235 bln
2.38K%
jan 1, 2004
6.428 mln
-1.281 bln
-99.5%
jan 1, 2010
166.471 mln
+160.043 mln
2.49K%
jan 1, 2015
0.0
-166.471 mln
-100.0%
Ranking of countries by current statistics by years


Comments: