29
/
en
AIzaSyAYiBZKx7MnpbEhh9jyipgxe19OcubqV5w
April 1, 2024
237029
Serbia
SRB
true
2
1
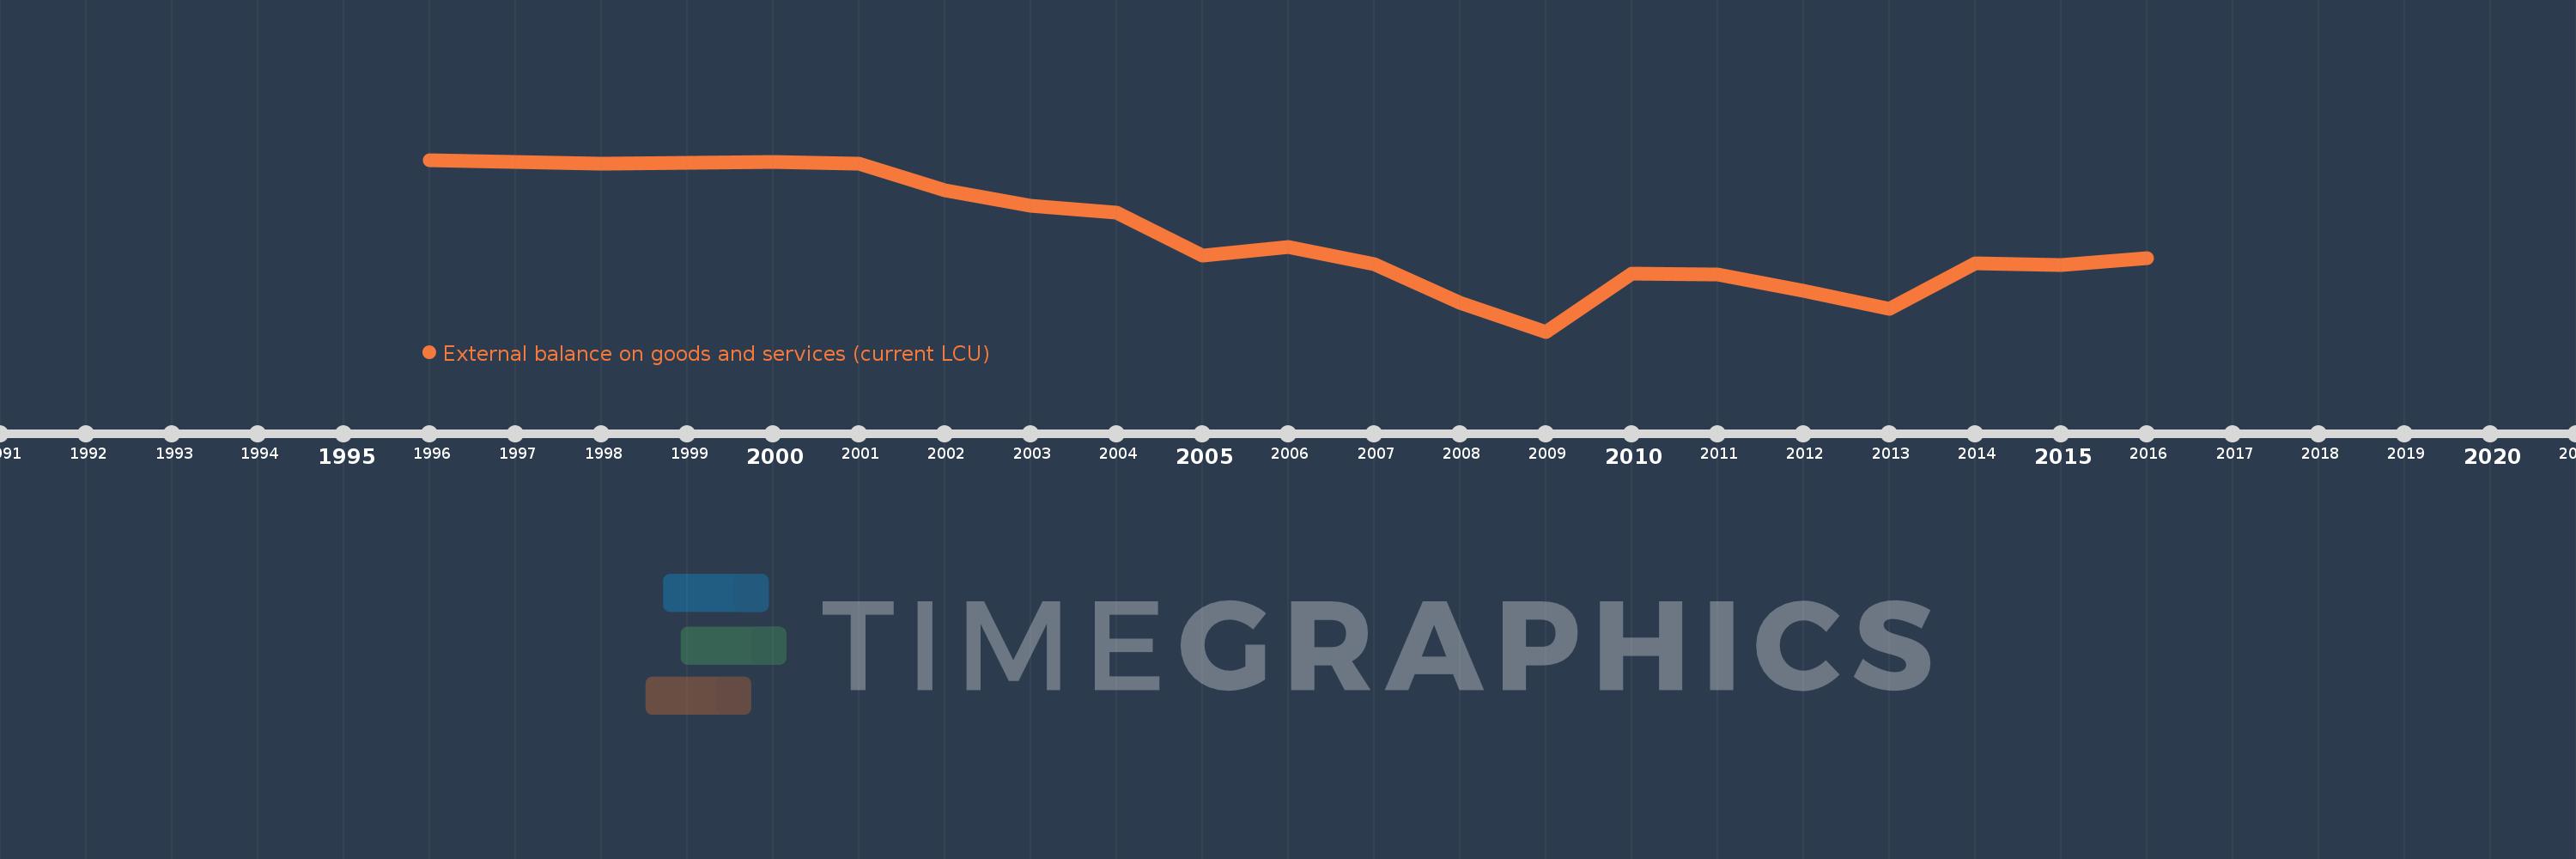
External balance on goods and services (current LCU)
2016,2015,2014,2013,2012,2011,2010,2009,2008,2007,2006,2005,2004,2003,2002,2001,2000,1999,1998,1997,1996
This statistics in other country:
AfghanistanAlbaniaAlgeriaAngolaAntigua and BarbudaArgentinaArmeniaArubaAustraliaAustriaAzerbaijanBahamas, TheBahrainBangladeshBarbadosBelarusBelgiumBelizeBeninBermudaBhutanBoliviaBosnia and HerzegovinaBotswanaBrazilBrunei DarussalamBulgariaBurkina FasoBurundiCabo VerdeCambodiaCameroonCanadaCentral African RepublicChadChileChinaColombiaComorosCongo, Dem. Rep.Congo, Rep.Costa RicaCote d'IvoireCroatiaCubaCyprusCzech RepublicDenmarkDjiboutiDominicaDominican RepublicEcuadorEgypt, Arab Rep.El SalvadorEquatorial GuineaEritreaEstoniaEthiopiaFaroe IslandsFijiFinlandFranceFrench PolynesiaGabonGambia, TheGeorgiaGermanyGhanaGreeceGrenadaGuatemalaGuineaGuinea-BissauGuyanaHaitiHondurasHong Kong SAR, ChinaHungaryIcelandIndiaIndonesiaIran, Islamic Rep.IraqIrelandIsraelItalyJamaicaJapanJordanKazakhstanKenyaKiribatiKorea, Rep.KosovoKuwaitKyrgyz RepublicLao PDRLatviaLebanonLesothoLiberiaLibyaLithuaniaLuxembourgMacao SAR, ChinaMacedonia, FYRMadagascarMalawiMalaysiaMaldivesMaliMaltaMauritaniaMauritiusMexicoMicronesia, Fed. Sts.MoldovaMongoliaMontenegroMoroccoMozambiqueMyanmarNamibiaNepalNetherlandsNew CaledoniaNew ZealandNicaraguaNigerNigeriaNorwayOmanPakistanPalauPanamaPapua New GuineaParaguayPeruPhilippinesPolandPortugalPuerto RicoQatarRomaniaRussian FederationRwandaSamoaSaudi ArabiaSenegalSerbiaSeychellesSierra LeoneSingaporeSlovak RepublicSloveniaSolomon IslandsSomaliaSouth AfricaSouth SudanSpainSri LankaSt. Kitts and NevisSt. LuciaSt. Vincent and the GrenadinesSudanSurinameSwazilandSwedenSwitzerlandSyrian Arab RepublicTajikistanTanzaniaThailandTimor-LesteTogoTongaTrinidad and TobagoTunisiaTurkeyTurkmenistanUgandaUkraineUnited Arab EmiratesUnited KingdomUnited StatesUruguayUzbekistanVanuatuVenezuela, RBVietnamWest Bank and GazaYemen, Rep.ZambiaZimbabwe Timeline:
This timeline shows a graph from 1996 to 2016 of Serbia. No data until 1995. Number of actual observations by date: 21.
Source name:
World Development Indicators
Source organization:
World Bank national accounts data, and OECD National Accounts data files.
Categories, topics:
Economy & Growth
Last updated:
apr 23, 2017
Indicators value changes by year
Minimum:
-686.832 bln
jan 1, 2009
Maximum:
-4.151 bln
jan 1, 1996
At the date of observation
Value
Absolute change
Change from previous value
jan 1, 1996
-4.151 bln
-4.151 bln
0.0%
jan 1, 1997
-13.56 bln
-9.409 bln
226.65%
jan 1, 1998
-20.305 bln
-6.745 bln
49.74%
jan 1, 1999
-16.895 bln
+3.41 bln
-16.79%
jan 1, 2000
-14.282 bln
+2.613 bln
-15.47%
jan 1, 2001
-18.441 bln
-4.159 bln
29.12%
jan 1, 2002
-125.592 bln
-107.151 bln
581.05%
jan 1, 2003
-187.653 bln
-62.062 bln
49.42%
jan 1, 2004
-214.603 bln
-26.95 bln
14.36%
jan 1, 2005
-383.384 bln
-168.78 bln
78.65%
jan 1, 2006
-350.245 bln
+33.139 bln
-8.64%
jan 1, 2007
-417.885 bln
-67.64 bln
19.31%
jan 1, 2008
-572.271 bln
-154.386 bln
36.94%
jan 1, 2009
-686.832 bln
-114.56 bln
20.02%
jan 1, 2010
-457.876 bln
+228.955 bln
-33.34%
jan 1, 2011
-459.741 bln
-1.865 bln
0.41%
jan 1, 2012
-524.677 bln
-64.935 bln
14.12%
jan 1, 2013
-597.432 bln
-72.755 bln
13.87%
jan 1, 2014
-415.122 bln
+182.31 bln
-30.52%
jan 1, 2015
-423.954 bln
-8.832 bln
2.13%
jan 1, 2016
-394.347 bln
+29.607 bln
-6.98%
Ranking of countries by current statistics by years


Comments: