29
/
en
AIzaSyAYiBZKx7MnpbEhh9jyipgxe19OcubqV5w
April 1, 2024
235988
Senegal
SEN
true
2
1
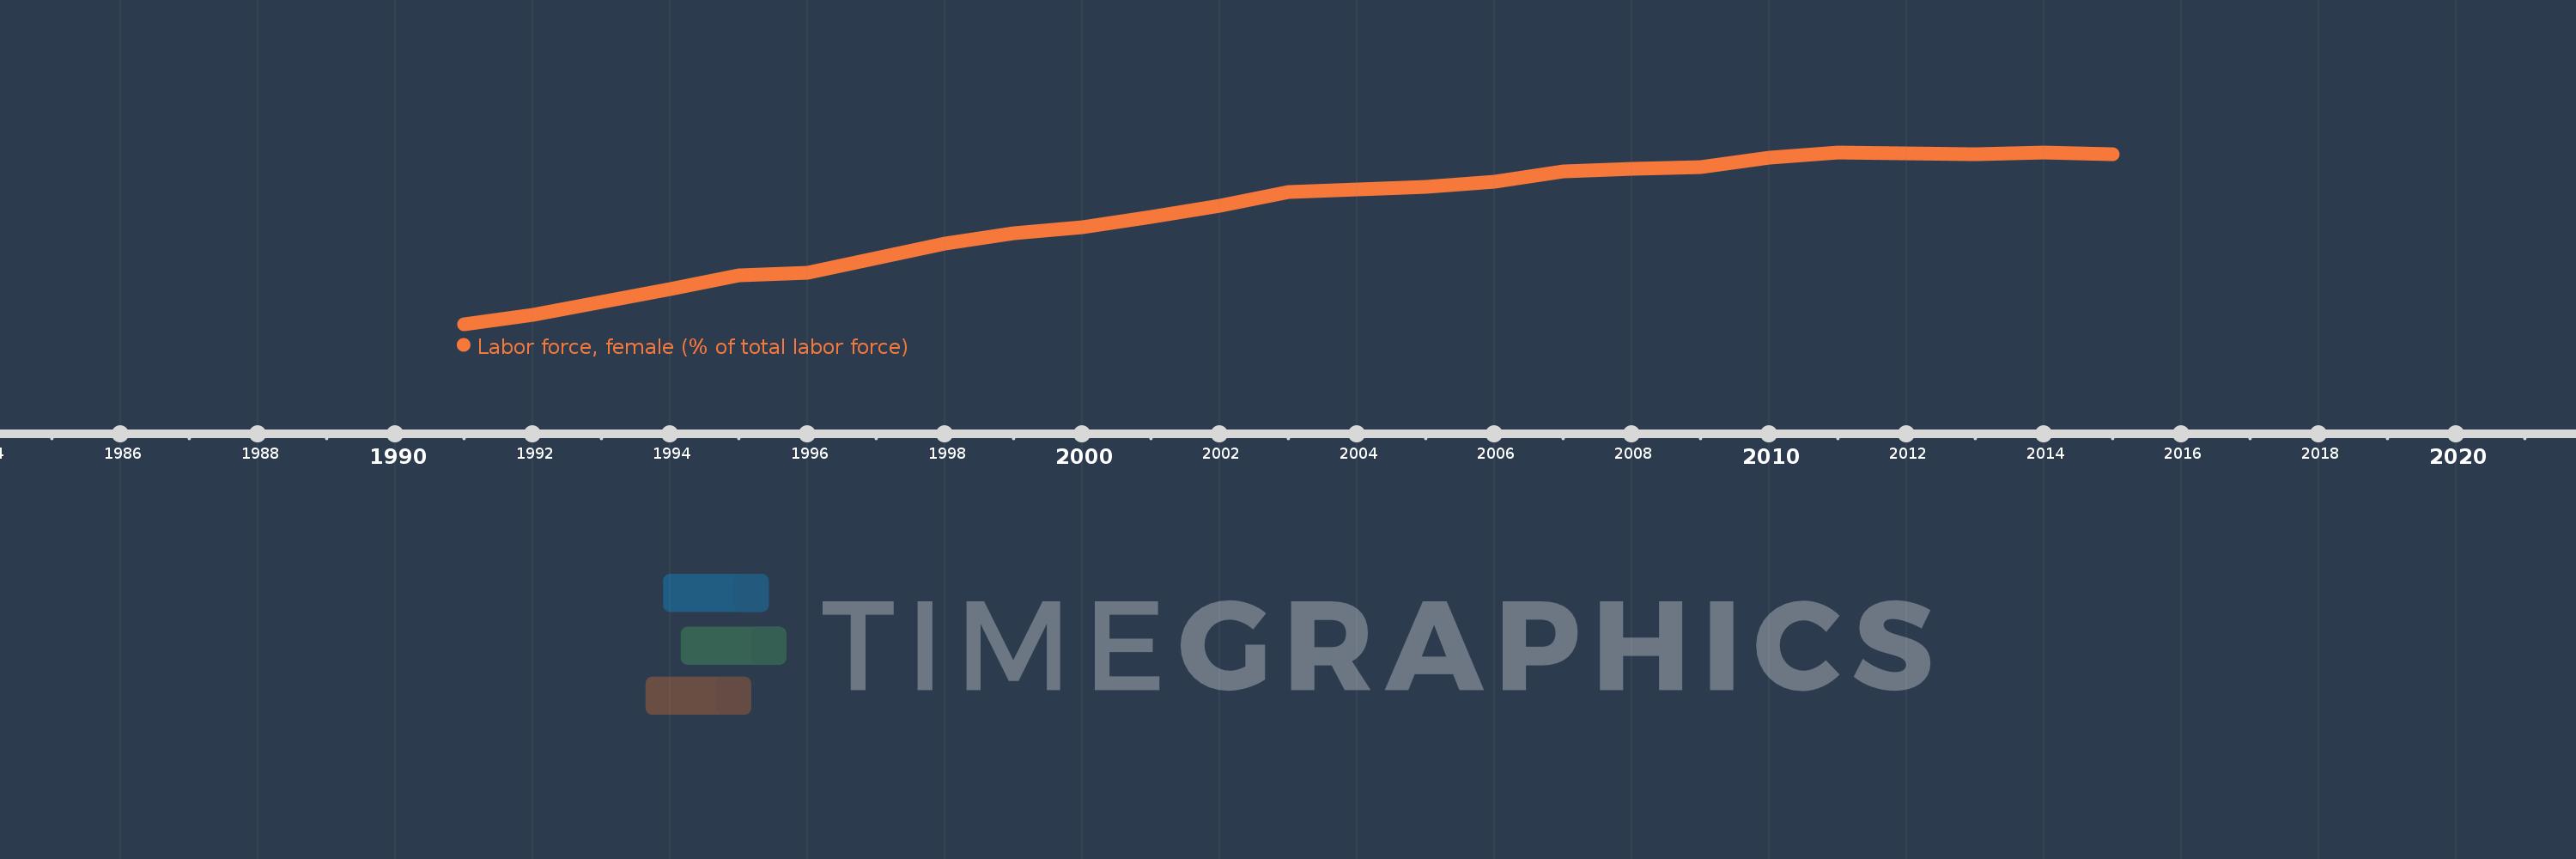
Labor force, female (% of total labor force)
2015,2014,2013,2012,2011,2010,2009,2008,2007,2006,2005,2004,2003,2002,2001,2000,1999,1998,1997,1996,1995,1994,1993,1992,1991
This statistics in other country:
AfghanistanAlbaniaAlgeriaAngolaArab WorldArgentinaArmeniaAustraliaAustriaAzerbaijanBahamas, TheBahrainBangladeshBarbadosBelarusBelgiumBelizeBeninBhutanBoliviaBosnia and HerzegovinaBotswanaBrazilBrunei DarussalamBulgariaBurkina FasoBurundiCabo VerdeCambodiaCameroonCanadaCaribbean small statesCentral African RepublicCentral Europe and the BalticsChadChannel IslandsChileChinaColombiaComorosCongo, Dem. Rep.Congo, Rep.Costa RicaCote d'IvoireCroatiaCubaCyprusCzech RepublicDenmarkDjiboutiDominican RepublicEarly-demographic dividendEast Asia & PacificEast Asia & Pacific (excluding high income)East Asia & Pacific (IDA & IBRD countries)EcuadorEgypt, Arab Rep.El SalvadorEquatorial GuineaEritreaEstoniaEthiopiaEuro areaEurope & Central AsiaEurope & Central Asia (excluding high income)Europe & Central Asia (IDA & IBRD countries)European UnionFijiFinlandFragile and conflict affected situationsFranceFrench PolynesiaGabonGambia, TheGeorgiaGermanyGhanaGreeceGuamGuatemalaGuineaGuinea-BissauGuyanaHaitiHeavily indebted poor countries (HIPC)High incomeHondurasHong Kong SAR, ChinaHungaryIBRD onlyIcelandIDA & IBRD totalIDA blendIDA onlyIDA totalIndiaIndonesiaIran, Islamic Rep.IraqIrelandIsraelItalyJamaicaJapanJordanKazakhstanKenyaKorea, Dem. People’s Rep.Korea, Rep.KuwaitKyrgyz RepublicLao PDRLate-demographic dividendLatin America & Caribbean Latin America & Caribbean (excluding high income)Latin America & the Caribbean (IDA & IBRD countries)LatviaLeast developed countries: UN classificationLebanonLesothoLiberiaLibyaLithuaniaLow & middle incomeLow incomeLower middle incomeLuxembourgMacao SAR, ChinaMacedonia, FYRMadagascarMalawiMalaysiaMaldivesMaliMaltaMauritaniaMauritiusMexicoMiddle East & North AfricaMiddle East & North Africa (excluding high income)Middle East & North Africa (IDA & IBRD countries)Middle incomeMoldovaMongoliaMontenegroMoroccoMozambiqueMyanmarNamibiaNepalNetherlandsNew CaledoniaNew ZealandNicaraguaNigerNigeriaNorth AmericaNorwayOECD membersOmanOther small statesPacific island small statesPakistanPanamaPapua New GuineaParaguayPeruPhilippinesPolandPortugalPost-demographic dividendPre-demographic dividendPuerto RicoQatarRomaniaRussian FederationRwandaSamoaSao Tome and PrincipeSaudi ArabiaSenegalSerbiaSierra LeoneSingaporeSlovak RepublicSloveniaSmall statesSolomon IslandsSomaliaSouth AfricaSouth AsiaSouth Asia (IDA & IBRD)SpainSri LankaSt. LuciaSt. Vincent and the GrenadinesSub-Saharan Africa Sub-Saharan Africa (excluding high income)Sub-Saharan Africa (IDA & IBRD countries)SudanSurinameSwazilandSwedenSwitzerlandSyrian Arab RepublicTajikistanTanzaniaThailandTimor-LesteTogoTongaTrinidad and TobagoTunisiaTurkeyTurkmenistanUgandaUkraineUnited Arab EmiratesUnited KingdomUnited StatesUpper middle incomeUruguayUzbekistanVanuatuVenezuela, RBVietnamVirgin Islands (U.S.)West Bank and GazaWorldYemen, Rep.ZambiaZimbabwe Timeline:
This timeline shows a graph from 1991 to 2015 of Senegal. No data until 1990. Number of actual observations by date: 25.
Source name:
World Development Indicators
Source organization:
International Labour Organization, using World Bank population estimates.
Categories, topics:
Education, Social Protection & Labor, Gender
Last updated:
apr 23, 2017
Indicators value changes by year
Minimum:
41.832
jan 1, 1991
Maximum:
44.997
jan 1, 2014
At the date of observation
Value
Absolute change
Change from previous value
jan 1, 1991
41.832
+41.832
0.0%
jan 1, 1992
42.001
+0.169
0.4%
jan 1, 1993
42.244
+0.243
0.58%
jan 1, 1994
42.477
+0.233
0.55%
jan 1, 1995
42.73
+0.253
0.6%
jan 1, 1996
42.784
+0.054
0.13%
jan 1, 1997
43.042
+0.258
0.6%
jan 1, 1998
43.312
+0.27
0.63%
jan 1, 1999
43.505
+0.193
0.45%
jan 1, 2000
43.619
+0.114
0.26%
jan 1, 2001
43.803
+0.184
0.42%
jan 1, 2002
44.007
+0.204
0.47%
jan 1, 2003
44.273
+0.267
0.61%
jan 1, 2004
44.312
+0.038
0.09%
jan 1, 2005
44.355
+0.043
0.1%
jan 1, 2006
44.456
+0.101
0.23%
jan 1, 2007
44.643
+0.187
0.42%
jan 1, 2008
44.691
+0.047
0.11%
jan 1, 2009
44.733
+0.042
0.09%
jan 1, 2010
44.903
+0.17
0.38%
jan 1, 2011
44.993
+0.09
0.2%
jan 1, 2012
44.982
-0.011
-0.02%
jan 1, 2013
44.963
-0.019
-0.04%
jan 1, 2014
44.997
+0.034
0.08%
jan 1, 2015
44.971
-0.026
-0.06%
Ranking of countries by current statistics by years


Comments: