29
/
en
AIzaSyAYiBZKx7MnpbEhh9jyipgxe19OcubqV5w
April 1, 2024
234116
Sao Tome and Principe
STP
true
2
1
Principal forgiven (current US$)
2016,2015,2014,2013,2012,2011,2010,2009,2008,2007,2006,2005,2004,2003,2002,2001,2000,1997
This statistics in other country:
Timeline:
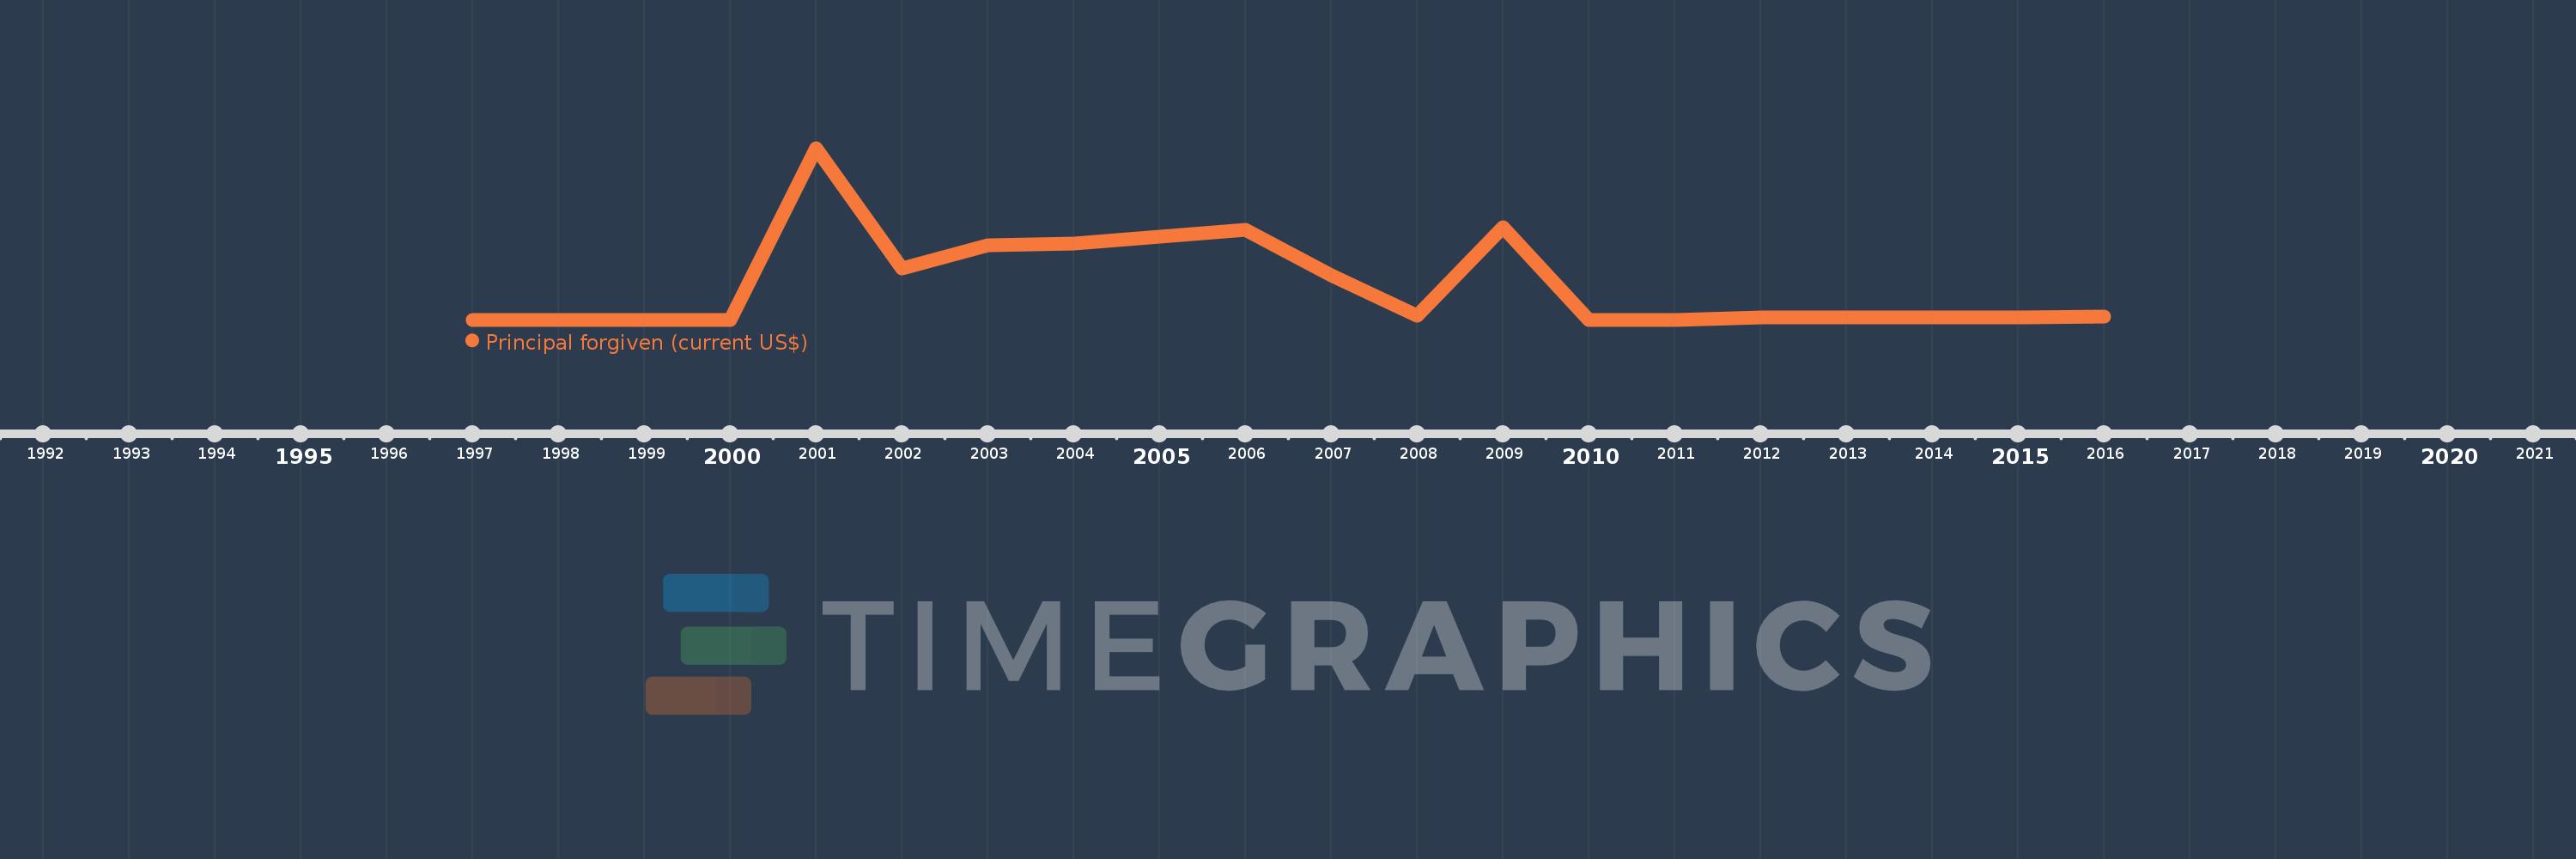
This timeline shows a graph from 1997 to 2016 of Sao Tome and Principe. No data until 1996. Number of actual observations by date: 18.
Source name:
World Development Indicators
Source organization:
World Bank, International Debt Statistics.
Categories, topics:
External Debt
Last updated:
apr 23, 2017
Indicators value changes by year
Maximum:
4.842 mln
jan 1, 2001
At the date of observation
Value
Absolute change
Change from previous value
jan 1, 2001
4.842 mln
+4.842 mln
%
jan 1, 2002
1.442 mln
-3.4 mln
-70.22%
jan 1, 2003
2.108 mln
+666.0K
46.19%
jan 1, 2004
2.139 mln
+31.0K
1.47%
jan 1, 2005
2.332 mln
+193.0K
9.02%
jan 1, 2006
2.53 mln
+198.0K
8.49%
jan 1, 2007
1.262 mln
-1.268 mln
-50.12%
jan 1, 2008
105.0K
-1.157 mln
-91.68%
jan 1, 2009
2.617 mln
+2.512 mln
2.39K%
jan 1, 2010
0.0
-2.617 mln
-100.0%
jan 1, 2012
71.0K
+71.0K
%
jan 1, 2013
65.0K
-6.0K
-8.45%
jan 1, 2014
70.0K
+5.0K
7.69%
jan 1, 2015
67.0K
-3.0K
-4.29%
jan 1, 2016
93.0K
+26.0K
38.81%
Ranking of countries by current statistics by years


Comments: