29
/
en
AIzaSyAYiBZKx7MnpbEhh9jyipgxe19OcubqV5w
April 1, 2024
234079
Sao Tome and Principe
STP
true
2
1
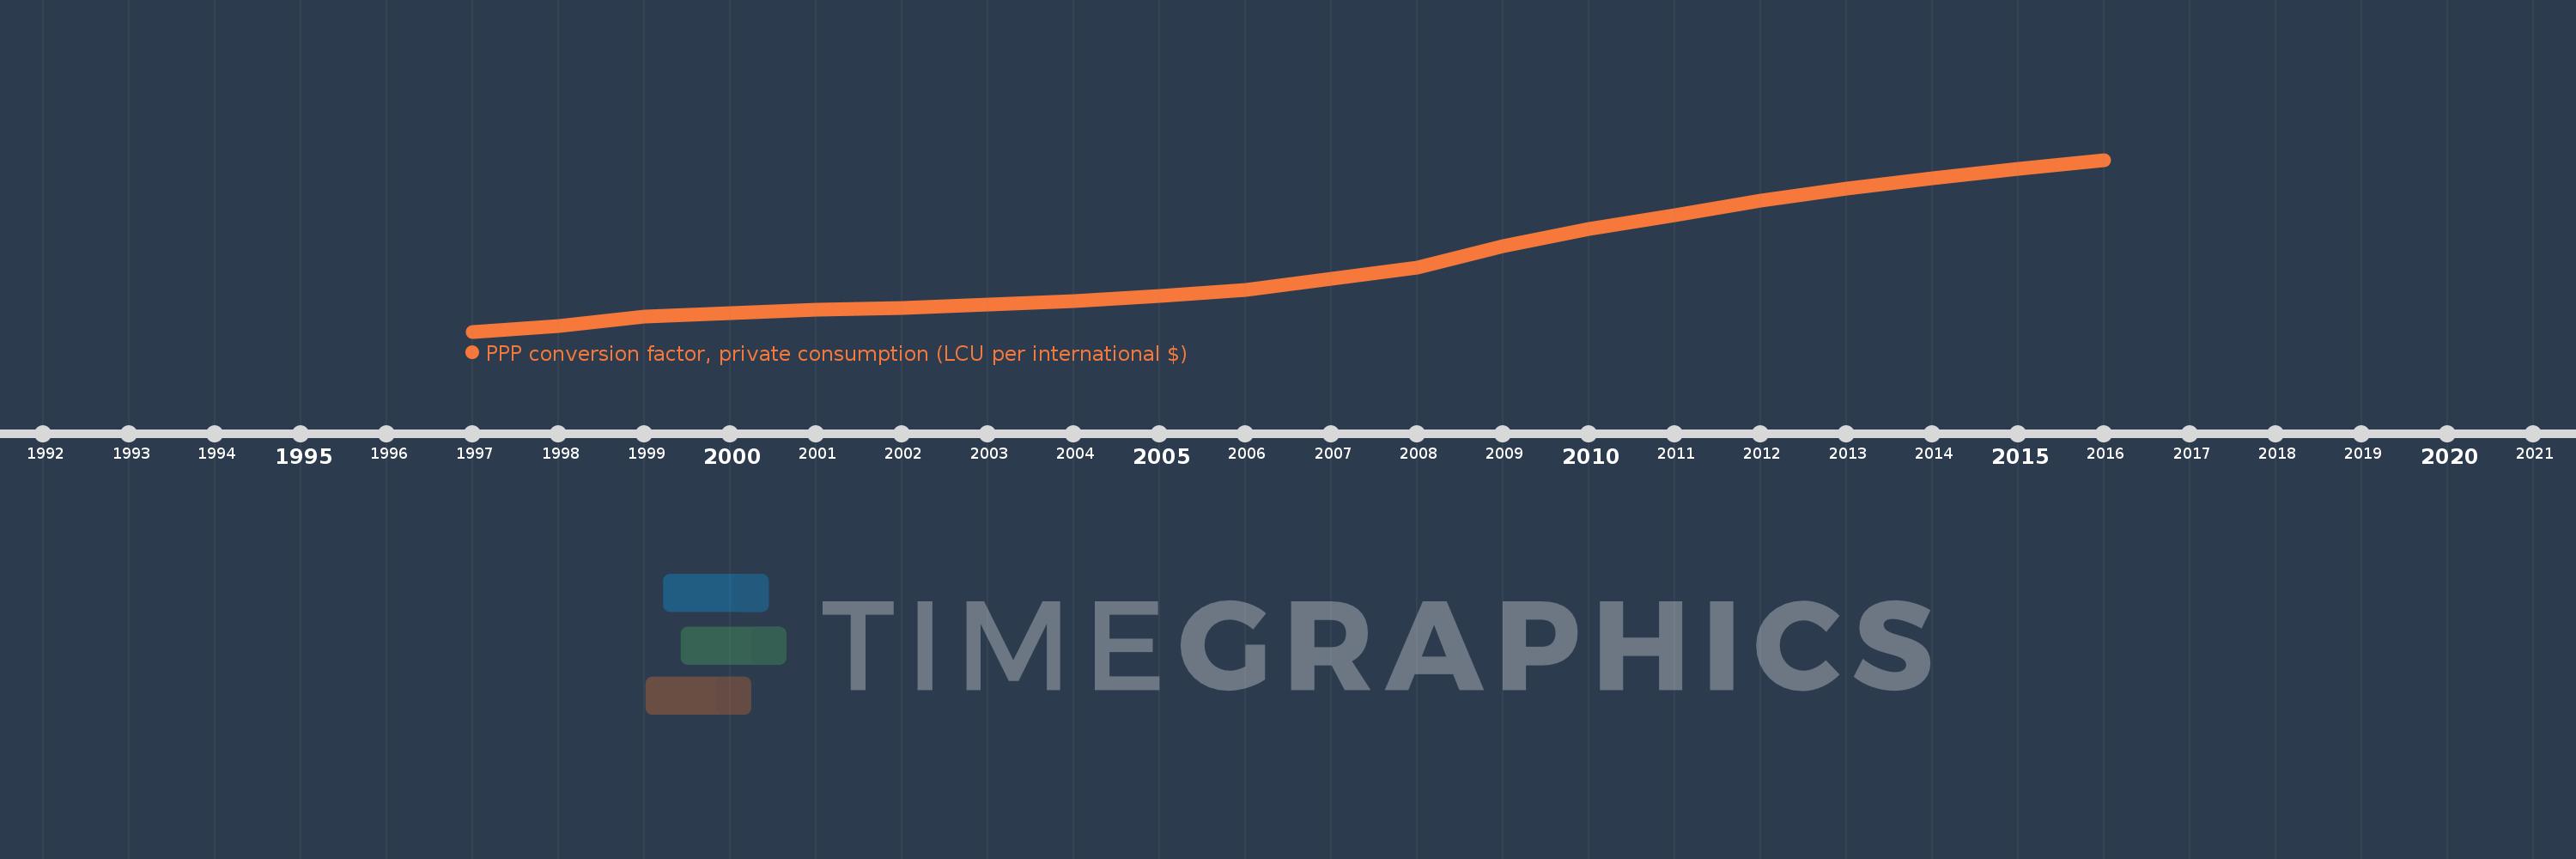
PPP conversion factor, private consumption (LCU per international $)
2016,2015,2014,2013,2012,2011,2010,2009,2008,2007,2006,2005,2004,2003,2002,2001,2000,1999,1998,1997
This statistics in other country:
AfghanistanAlbaniaAlgeriaAmerican SamoaAngolaAntigua and BarbudaArgentinaArmeniaArubaAustraliaAustriaAzerbaijanBahamas, TheBahrainBangladeshBarbadosBelarusBelgiumBelizeBeninBermudaBhutanBoliviaBosnia and HerzegovinaBotswanaBrazilBritish Virgin IslandsBrunei DarussalamBulgariaBurkina FasoBurundiCabo VerdeCambodiaCameroonCanadaCayman IslandsCentral African RepublicChadChileChinaColombiaComorosCongo, Dem. Rep.Congo, Rep.Costa RicaCote d'IvoireCroatiaCubaCuracaoCyprusCzech RepublicDenmarkDjiboutiDominicaDominican RepublicEcuadorEgypt, Arab Rep.El SalvadorEquatorial GuineaEritreaEstoniaEthiopiaFijiFinlandFranceFrench PolynesiaGabonGambia, TheGeorgiaGermanyGhanaGreeceGrenadaGuamGuatemalaGuineaGuinea-BissauGuyanaHaitiHondurasHong Kong SAR, ChinaHungaryIcelandIndiaIndonesiaIran, Islamic Rep.IraqIrelandIsraelItalyJamaicaJapanJordanKazakhstanKenyaKiribatiKorea, Rep.KosovoKuwaitKyrgyz RepublicLao PDRLatviaLebanonLesothoLiberiaLibyaLithuaniaLuxembourgMacao SAR, ChinaMacedonia, FYRMadagascarMalawiMalaysiaMaldivesMaliMaltaMarshall IslandsMauritaniaMauritiusMexicoMicronesia, Fed. Sts.MoldovaMongoliaMontenegroMoroccoMozambiqueMyanmarNamibiaNauruNepalNetherlandsNew CaledoniaNew ZealandNicaraguaNigerNigeriaNorthern Mariana IslandsNorwayOmanPakistanPalauPanamaPapua New GuineaParaguayPeruPhilippinesPolandPortugalPuerto RicoQatarRomaniaRussian FederationRwandaSamoaSan MarinoSao Tome and PrincipeSaudi ArabiaSenegalSerbiaSeychellesSierra LeoneSingaporeSint Maarten (Dutch part)Slovak RepublicSloveniaSolomon IslandsSomaliaSouth AfricaSouth SudanSpainSri LankaSt. Kitts and NevisSt. LuciaSt. Vincent and the GrenadinesSudanSurinameSwazilandSwedenSwitzerlandSyrian Arab RepublicTajikistanTanzaniaThailandTimor-LesteTogoTongaTrinidad and TobagoTunisiaTurkeyTurkmenistanTurks and Caicos IslandsTuvaluUgandaUkraineUnited Arab EmiratesUnited KingdomUnited StatesUruguayUzbekistanVanuatuVenezuela, RBVietnamWest Bank and GazaYemen, Rep.ZambiaZimbabwe Timeline:
This timeline shows a graph from 1997 to 2016 of Sao Tome and Principe. No data until 1996. Number of actual observations by date: 20.
Source name:
World Development Indicators
Source organization:
World Bank, International Comparison Program database.
Categories, topics:
Economy & Growth
Last updated:
apr 23, 2017
Indicators value changes by year
Minimum:
1.106K
jan 1, 1997
Maximum:
13.032K
jan 1, 2016
At the date of observation
Value
Absolute change
Change from previous value
jan 1, 1997
1.106K
+1.106K
0.0%
jan 1, 1998
1.467K
+361.677
32.71%
jan 1, 1999
2.174K
+707.097
48.19%
jan 1, 2000
2.399K
+224.206
10.31%
jan 1, 2001
2.603K
+204.92
8.54%
jan 1, 2002
2.765K
+161.937
6.22%
jan 1, 2003
2.998K
+232.55
8.41%
jan 1, 2004
3.218K
+220.509
7.36%
jan 1, 2005
3.551K
+332.531
10.33%
jan 1, 2006
4.024K
+472.562
13.31%
jan 1, 2007
4.797K
+773.755
19.23%
jan 1, 2008
5.529K
+732.091
15.26%
jan 1, 2009
7.028K
+1.499K
27.11%
jan 1, 2010
8.25K
+1.221K
17.37%
jan 1, 2011
9.199K
+949.628
11.51%
jan 1, 2012
10.195K
+995.577
10.82%
jan 1, 2013
11.051K
+855.84
8.39%
jan 1, 2014
11.774K
+723.278
6.55%
jan 1, 2015
12.397K
+622.893
5.29%
jan 1, 2016
13.032K
+634.844
5.12%
Ranking of countries by current statistics by years


Comments: