29
/
en
AIzaSyAYiBZKx7MnpbEhh9jyipgxe19OcubqV5w
April 1, 2024
232696
Samoa
WSM
true
2
1
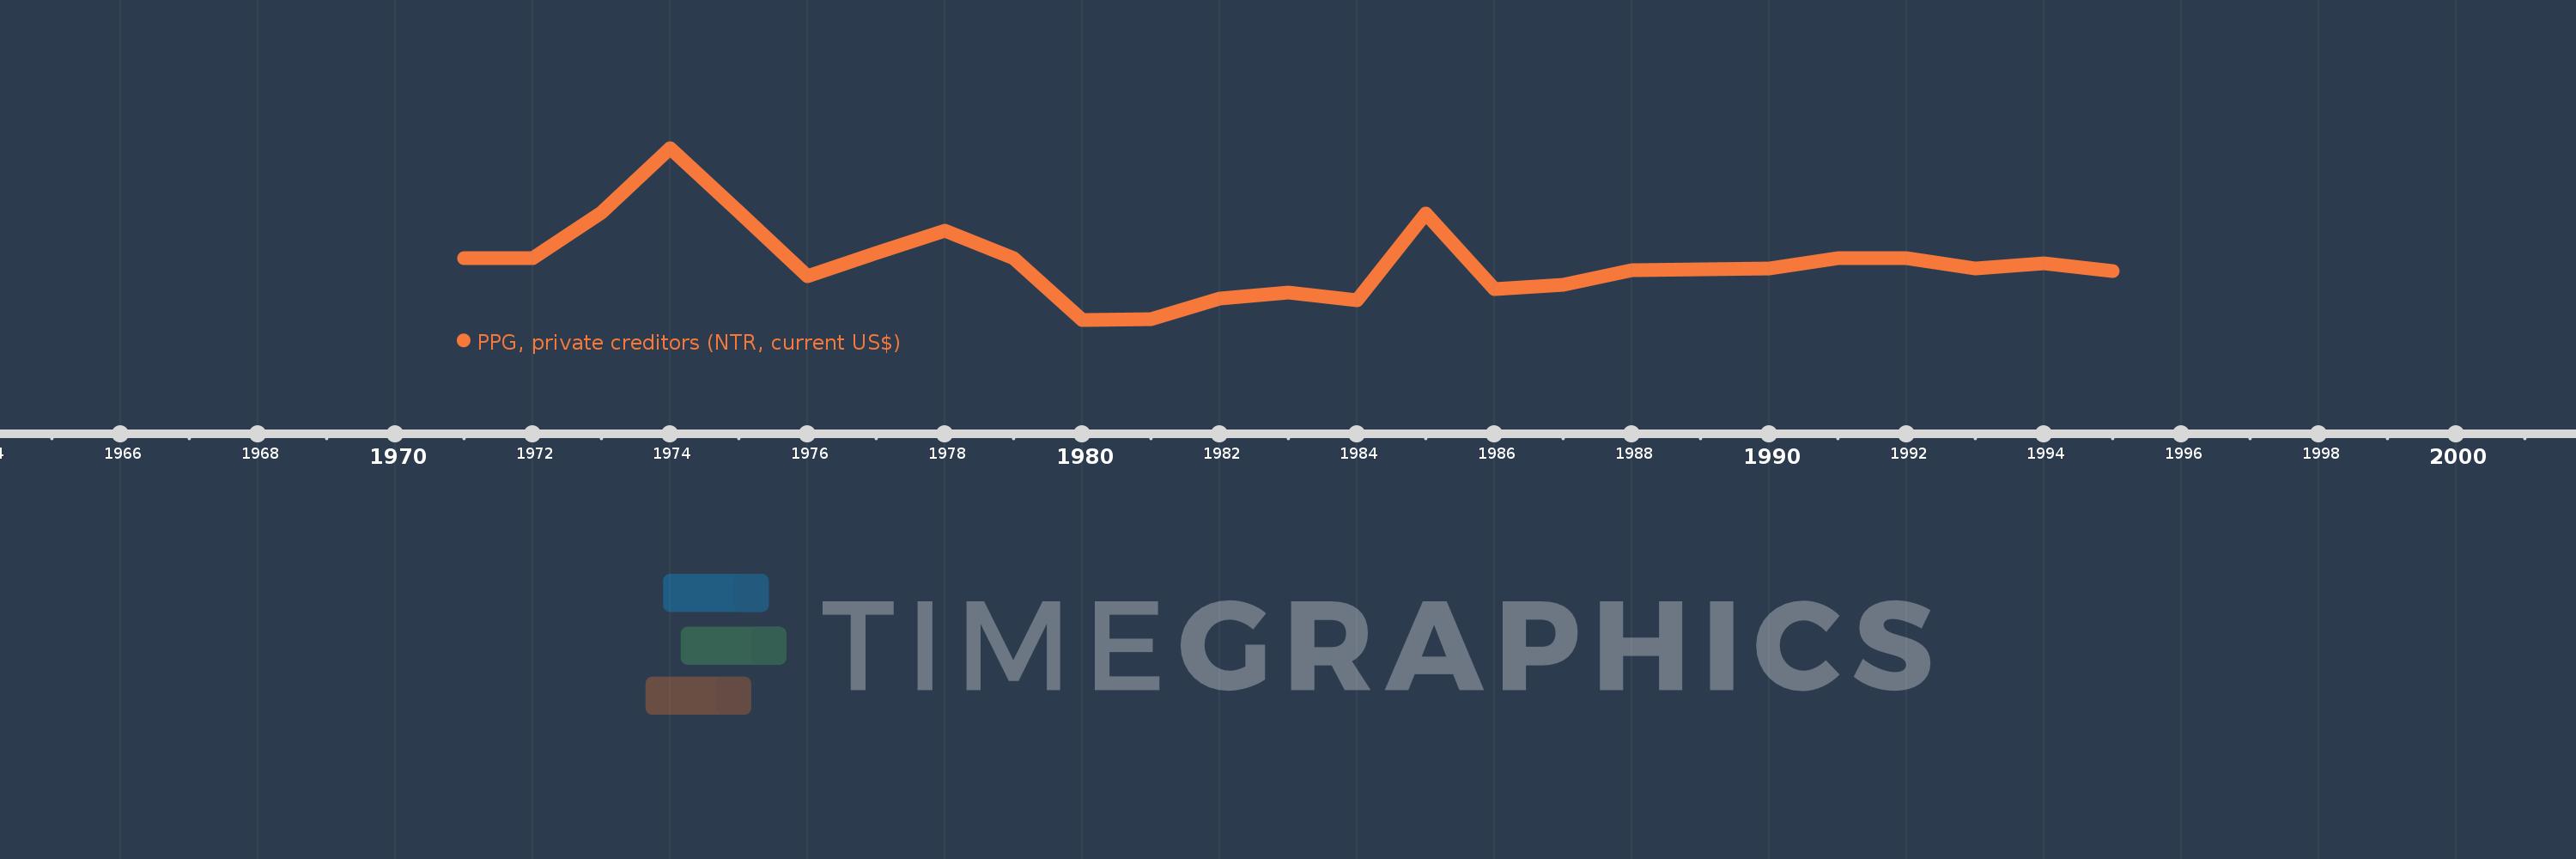
PPG, private creditors (NTR, current US$)
1995,1994,1993,1992,1991,1990,1989,1988,1987,1986,1985,1984,1983,1982,1981,1980,1979,1978,1977,1976,1975,1974,1973,1972,1971
This statistics in other country:
Timeline:
This timeline shows a graph from 1971 to 1995 of Samoa. No data until 1970. Number of actual observations by date: 25.
Source name:
World Development Indicators
Source organization:
World Bank, International Debt Statistics.
Categories, topics:
External Debt
Last updated:
apr 23, 2017
Indicators value changes by year
Minimum:
-2.689 mln
jan 1, 1980
Maximum:
4.622 mln
jan 1, 1974
At the date of observation
Value
Absolute change
Change from previous value
jan 1, 1971
-75.0K
-75.0K
0.0%
jan 1, 1972
-72.0K
+3.0K
-4.0%
jan 1, 1973
1.874 mln
+1.946 mln
-2.7K%
jan 1, 1974
4.622 mln
+2.748 mln
146.64%
jan 1, 1975
1.902 mln
-2.72 mln
-58.85%
jan 1, 1976
-841.0K
-2.743 mln
-144.22%
jan 1, 1977
155.0K
+996.0K
-118.43%
jan 1, 1978
1.116 mln
+961.0K
620.0%
jan 1, 1979
-55.0K
-1.171 mln
-104.93%
jan 1, 1980
-2.689 mln
-2.634 mln
4.79K%
jan 1, 1981
-2.681 mln
+8.0K
-0.3%
jan 1, 1982
-1.778 mln
+903.0K
-33.68%
jan 1, 1983
-1.518 mln
+260.0K
-14.62%
jan 1, 1984
-1.87 mln
-352.0K
23.19%
jan 1, 1985
1.833 mln
+3.703 mln
-198.02%
jan 1, 1986
-1.385 mln
-3.218 mln
-175.56%
jan 1, 1987
-1.186 mln
+199.0K
-14.37%
jan 1, 1988
-568.0K
+618.0K
-52.11%
jan 1, 1989
-553.0K
+15.0K
-2.64%
jan 1, 1990
-517.0K
+36.0K
-6.51%
jan 1, 1991
-82.0K
+435.0K
-84.14%
jan 1, 1992
-80.0K
+2.0K
-2.44%
jan 1, 1993
-492.0K
-412.0K
515.0%
jan 1, 1994
-295.0K
+197.0K
-40.04%
jan 1, 1995
-631.0K
-336.0K
113.9%
Ranking of countries by current statistics by years


Comments: