29
/
en
AIzaSyAYiBZKx7MnpbEhh9jyipgxe19OcubqV5w
April 1, 2024
232355
Samoa
WSM
true
2
1
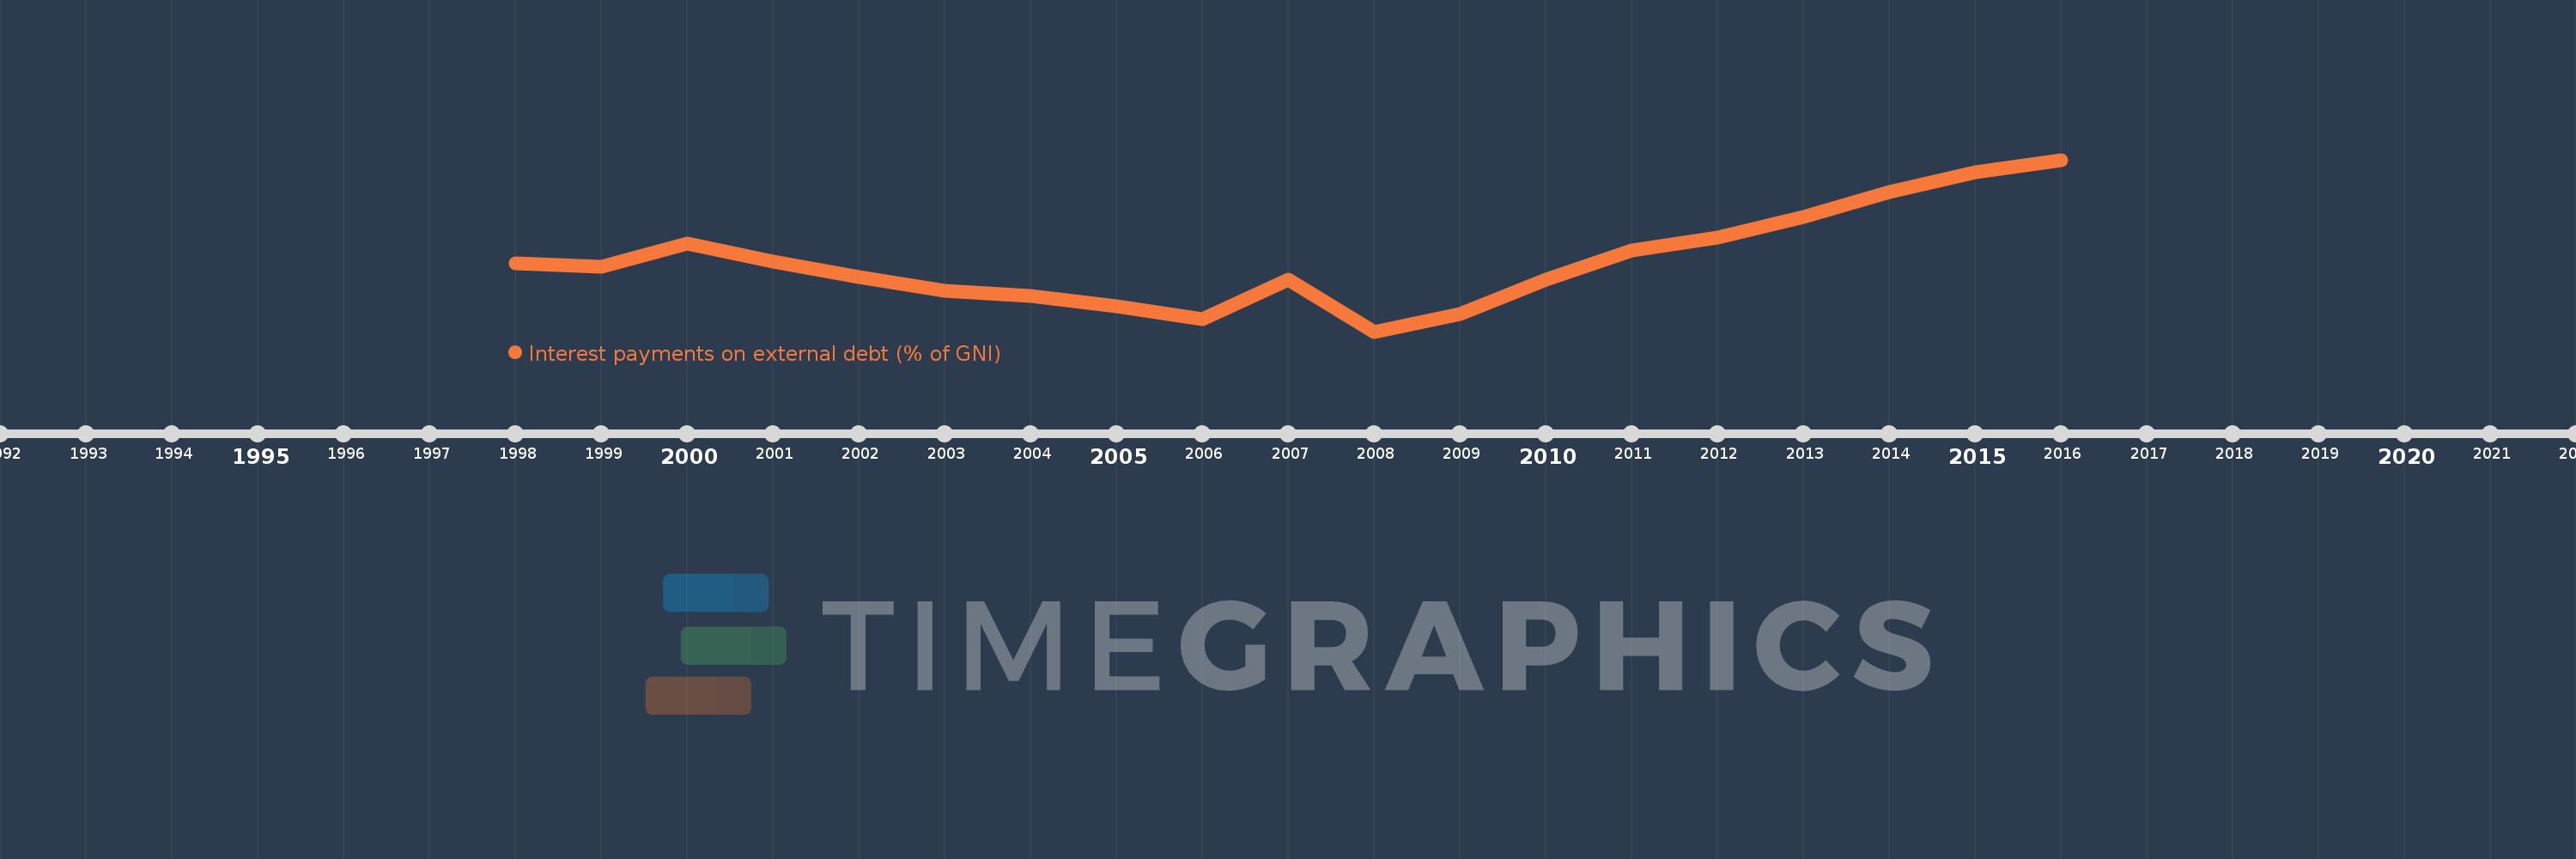
Interest payments on external debt (% of GNI)
2016,2015,2014,2013,2012,2011,2010,2009,2008,2007,2006,2005,2004,2003,2002,2001,2000,1999,1998
This statistics in other country:
Timeline:
This timeline shows a graph from 1998 to 2016 of Samoa. No data until 1997. Number of actual observations by date: 19.
Source name:
World Development Indicators
Source organization:
World Bank, International Debt Statistics.
Categories, topics:
Economy & Growth, External Debt
Last updated:
apr 23, 2017
Indicators value changes by year
At the date of observation
Value
Absolute change
Change from previous value
jan 1, 1998
0.496
+0.496
0.0%
jan 1, 1999
0.488
-0.008
-1.6%
jan 1, 2000
0.549
+0.061
12.42%
jan 1, 2001
0.501
-0.048
-8.73%
jan 1, 2002
0.461
-0.04
-8.01%
jan 1, 2003
0.426
-0.035
-7.58%
jan 1, 2004
0.413
-0.013
-3.1%
jan 1, 2005
0.386
-0.027
-6.51%
jan 1, 2006
0.352
-0.034
-8.88%
jan 1, 2007
0.454
+0.103
29.18%
jan 1, 2008
0.319
-0.135
-29.8%
jan 1, 2009
0.364
+0.045
14.05%
jan 1, 2010
0.454
+0.091
24.96%
jan 1, 2011
0.53
+0.076
16.68%
jan 1, 2012
0.565
+0.035
6.56%
jan 1, 2013
0.617
+0.052
9.18%
jan 1, 2014
0.683
+0.066
10.75%
jan 1, 2015
0.734
+0.051
7.49%
jan 1, 2016
0.767
+0.033
4.45%
Ranking of countries by current statistics by years


Comments: