29
/
en
AIzaSyAYiBZKx7MnpbEhh9jyipgxe19OcubqV5w
April 1, 2024
230304
Russian Federation
RUS
true
2
1
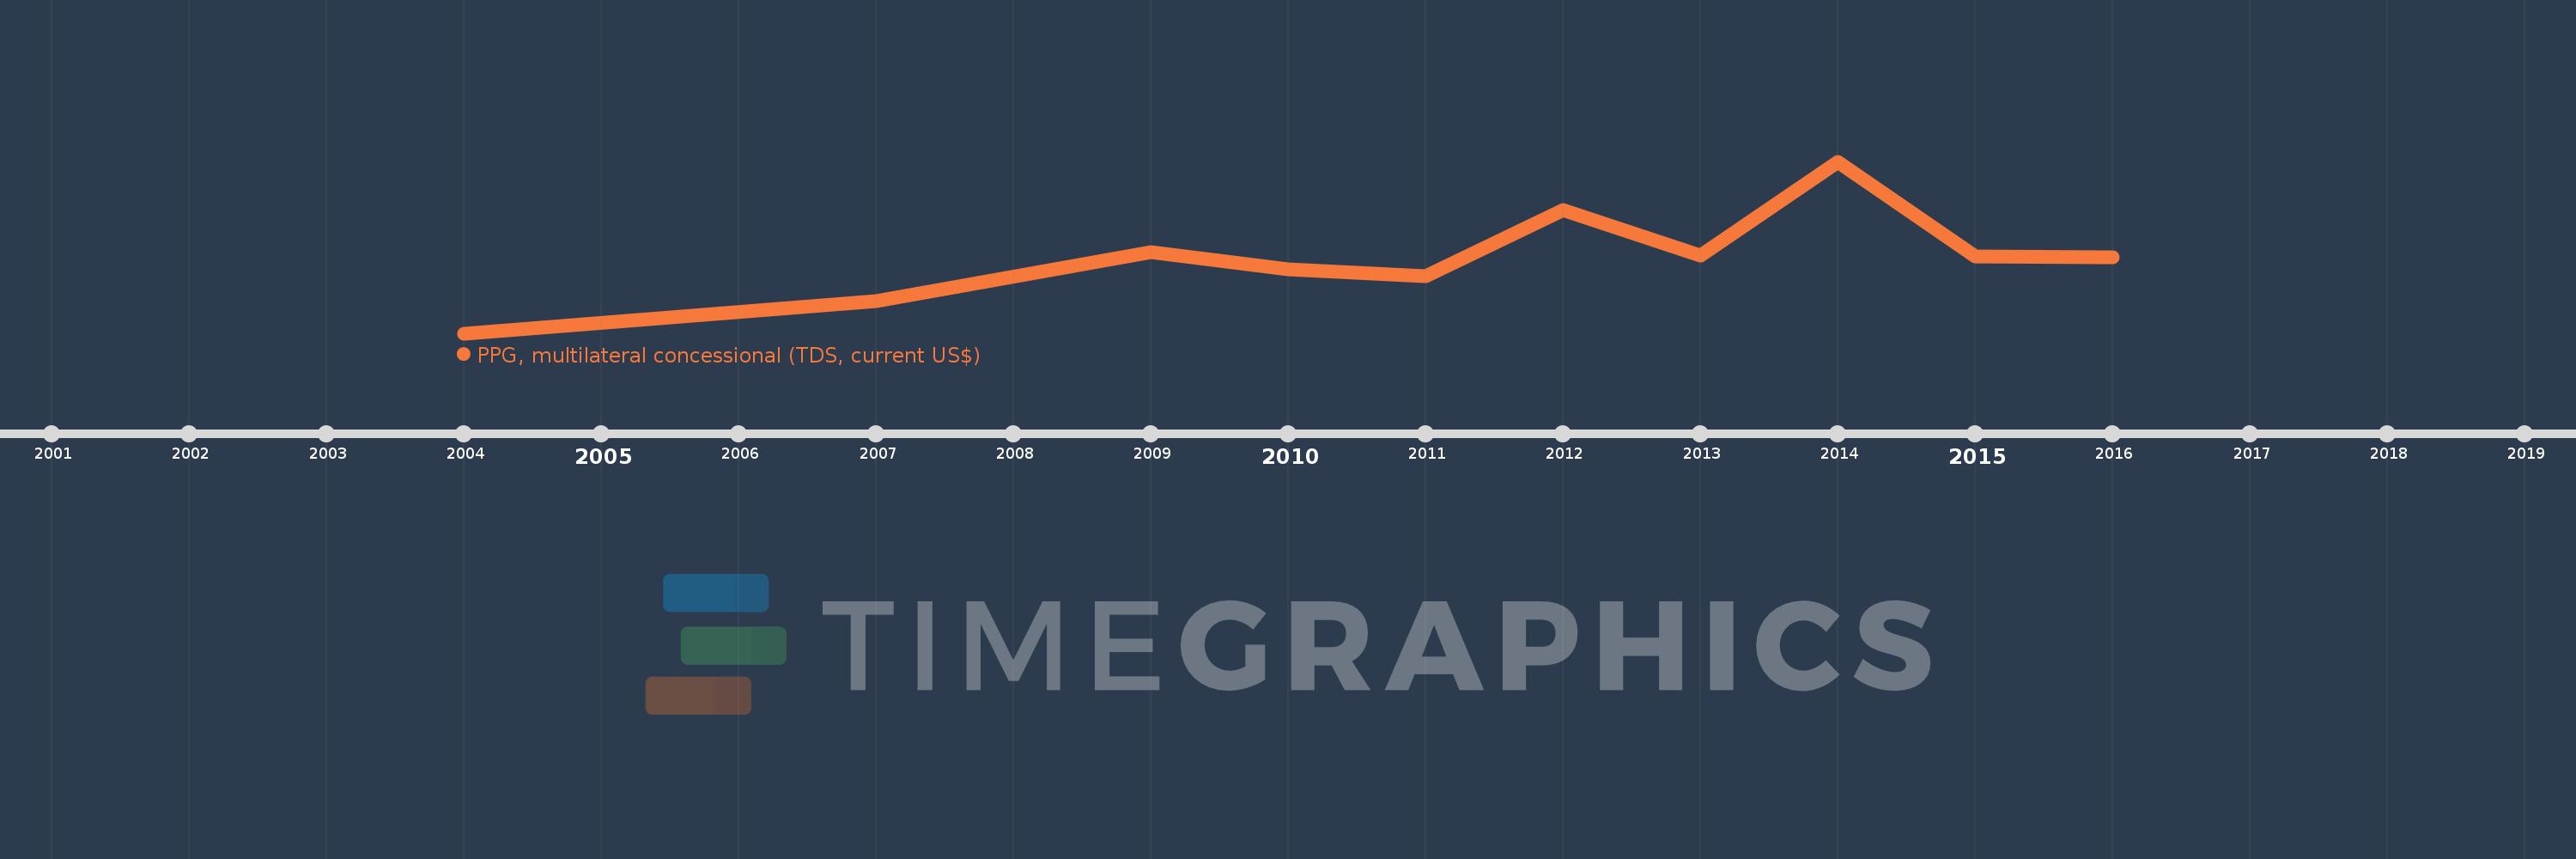
PPG, multilateral concessional (TDS, current US$)
2016,2015,2014,2013,2012,2011,2010,2009,2007,2004
This statistics in other country:
Timeline:
This timeline shows a graph from 2004 to 2016 of Russian Federation. No data until 2003. Number of actual observations by date: 10.
Source name:
World Development Indicators
Source organization:
World Bank, International Debt Statistics.
Categories, topics:
External Debt
Last updated:
apr 23, 2017
Indicators value changes by year
Maximum:
9.106 mln
jan 1, 2014
At the date of observation
Value
Absolute change
Change from previous value
jan 1, 2004
2.0K
+2.0K
0.0%
jan 1, 2007
1.693 mln
+1.691 mln
84.55K%
jan 1, 2009
4.293 mln
+2.6 mln
153.57%
jan 1, 2010
3.385 mln
-908.0K
-21.15%
jan 1, 2011
3.029 mln
-356.0K
-10.52%
jan 1, 2012
6.538 mln
+3.509 mln
115.85%
jan 1, 2013
4.128 mln
-2.41 mln
-36.86%
jan 1, 2014
9.106 mln
+4.978 mln
120.59%
jan 1, 2015
4.073 mln
-5.033 mln
-55.27%
jan 1, 2016
4.049 mln
-24.0K
-0.59%
Ranking of countries by current statistics by years


Comments: