29
/
en
AIzaSyAYiBZKx7MnpbEhh9jyipgxe19OcubqV5w
April 1, 2024
228992
Romania
ROU
true
2
1
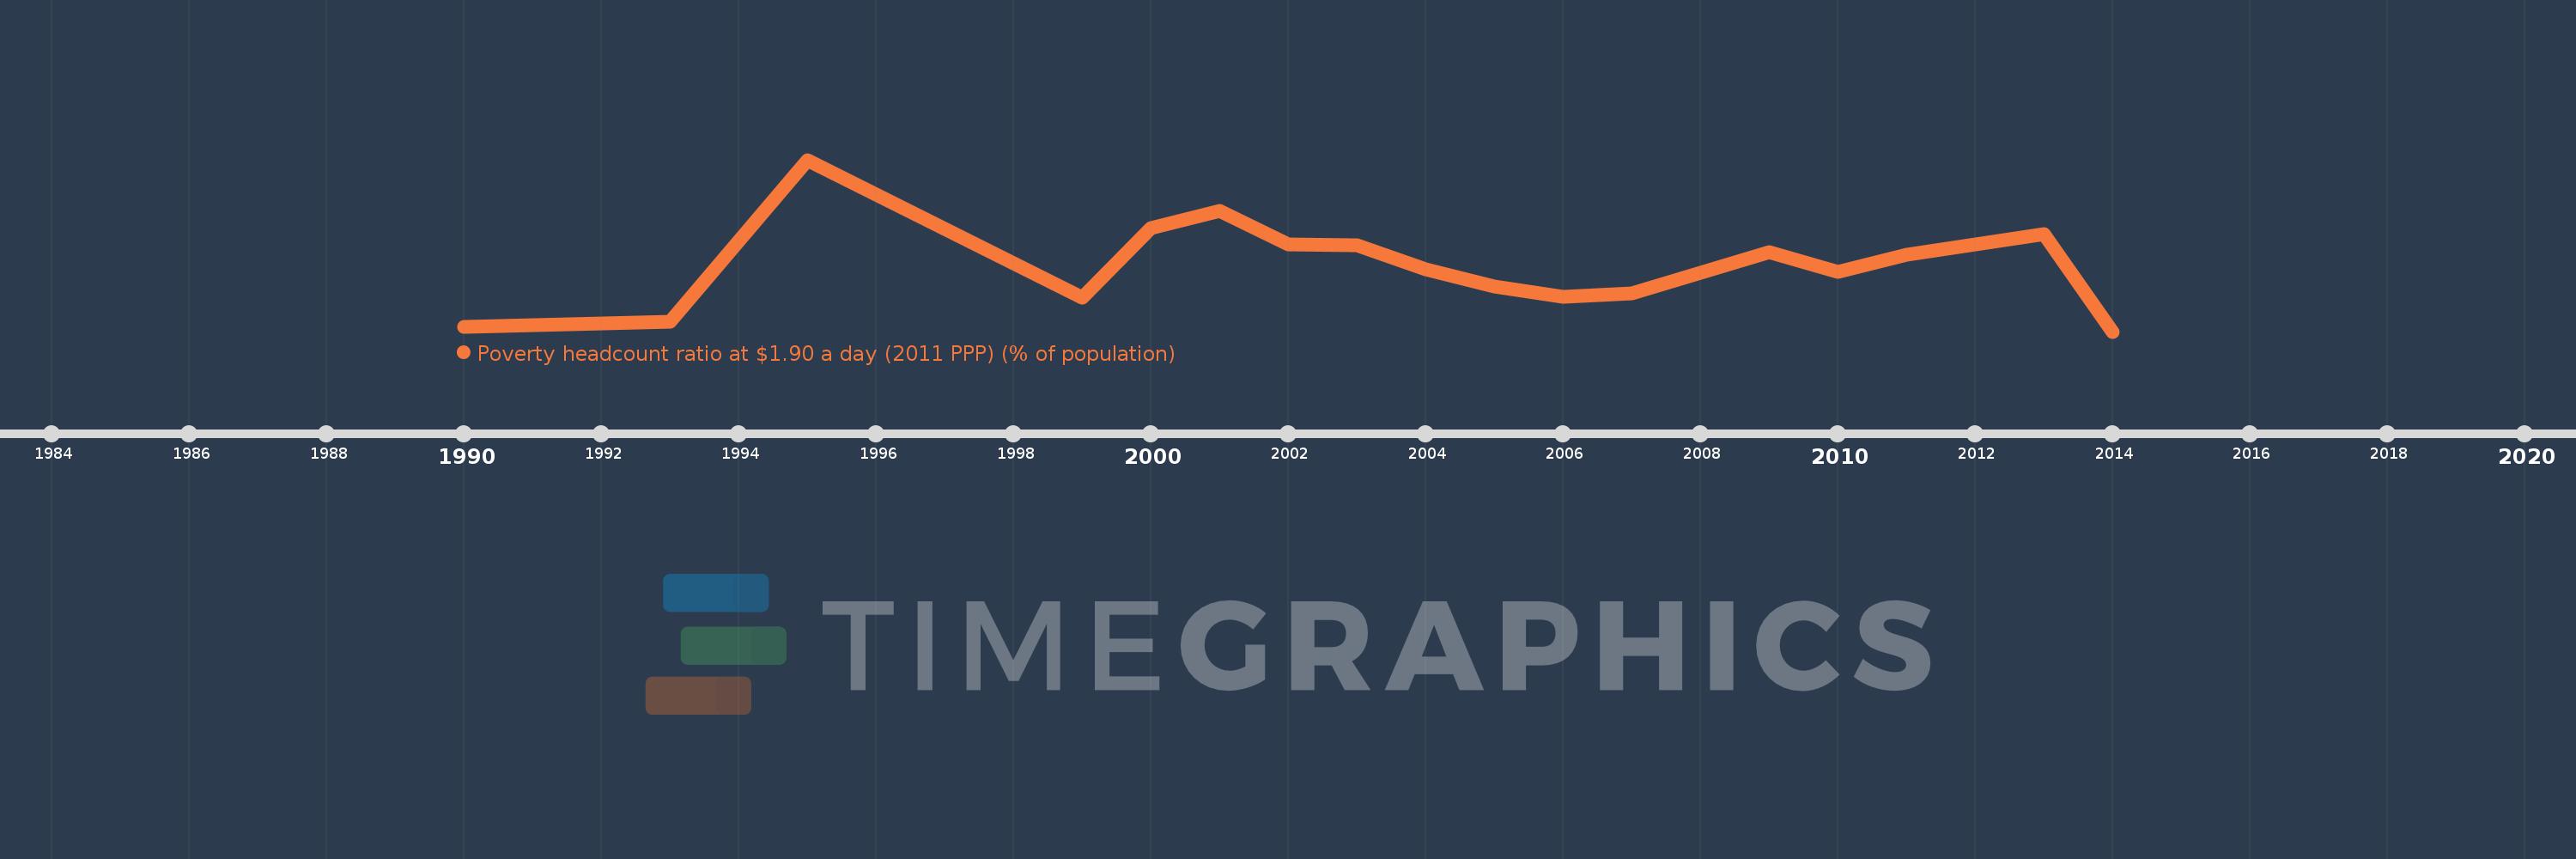
Poverty headcount ratio at $1.90 a day (2011 PPP) (% of population)
2014,2013,2011,2010,2009,2007,2006,2005,2004,2003,2002,2001,2000,1999,1995,1993,1990
This statistics in other country:
Timeline:
This timeline shows a graph from 1990 to 2014 of Romania. No data until 1989. Number of actual observations by date: 17.
Source name:
World Development Indicators
Source organization:
World Bank, Development Research Group. Data are based on primary household survey data obtained from government statistical agencies and World Bank country departments. Data for high-income economies are from the Luxembourg Income Study database. For more information and methodology, please see PovcalNet (http://iresearch.worldbank.org/PovcalNet/index.htm).
Categories, topics:
Poverty, Aid Effectiveness, Climate Change
Last updated:
apr 23, 2017
Indicators value changes by year
At the date of observation
Value
Absolute change
Change from previous value
jan 1, 1993
0.62
+0.32
106.67%
jan 1, 1995
10.72
+10.1
1.63K%
jan 1, 1999
2.11
-8.61
-80.32%
jan 1, 2000
6.46
+4.35
206.16%
jan 1, 2001
7.54
+1.08
16.72%
jan 1, 2002
5.45
-2.09
-27.72%
jan 1, 2003
5.4
-0.05
-0.92%
jan 1, 2004
3.87
-1.53
-28.33%
jan 1, 2005
2.84
-1.03
-26.61%
jan 1, 2006
2.15
-0.69
-24.3%
jan 1, 2007
2.36
+0.21
9.77%
jan 1, 2009
4.94
+2.58
109.32%
jan 1, 2010
3.72
-1.22
-24.7%
jan 1, 2011
4.78
+1.06
28.49%
jan 1, 2013
6.11
+1.33
27.82%
jan 1, 2014
0.0
-6.11
-100.0%
Ranking of countries by current statistics by years


Comments: