29
/
en
AIzaSyAYiBZKx7MnpbEhh9jyipgxe19OcubqV5w
April 1, 2024
228894
Romania
ROU
true
2
1
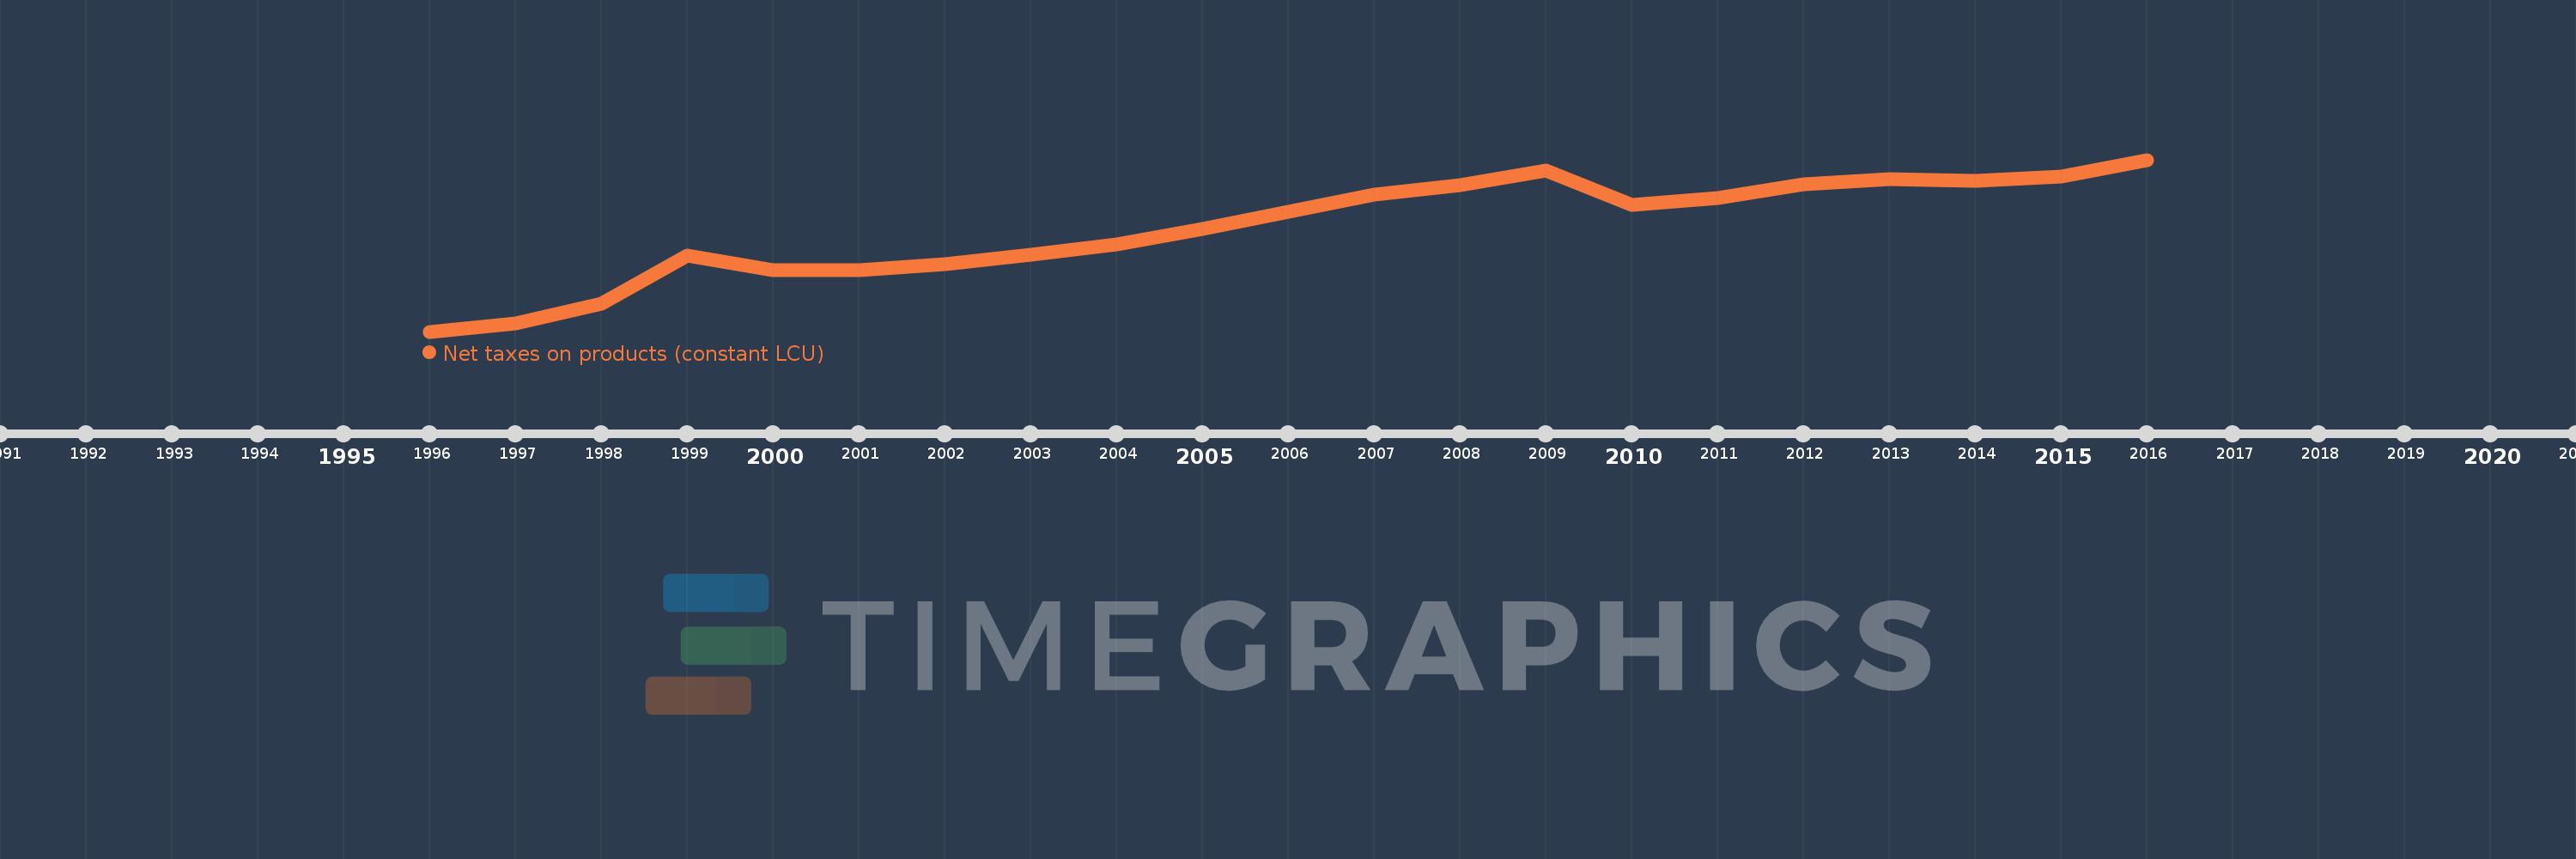
Net taxes on products (constant LCU)
2016,2015,2014,2013,2012,2011,2010,2009,2008,2007,2006,2005,2004,2003,2002,2001,2000,1999,1998,1997,1996
This statistics in other country:
Timeline:
This timeline shows a graph from 1996 to 2016 of Romania. No data until 1995. Number of actual observations by date: 21.
Source name:
World Development Indicators
Source organization:
World Bank national accounts data, and OECD National Accounts data files.
Categories, topics:
Economy & Growth
Last updated:
apr 23, 2017
Indicators value changes by year
Minimum:
14.476 bln
jan 1, 1996
Maximum:
42.052 bln
jan 1, 2016
At the date of observation
Value
Absolute change
Change from previous value
jan 1, 1996
14.476 bln
+14.476 bln
0.0%
jan 1, 1997
15.73 bln
+1.255 bln
8.67%
jan 1, 1998
18.912 bln
+3.182 bln
20.23%
jan 1, 1999
26.728 bln
+7.816 bln
41.32%
jan 1, 2000
24.368 bln
-2.36 bln
-8.83%
jan 1, 2001
24.305 bln
-63.3 mln
-0.26%
jan 1, 2002
25.297 bln
+992.2 mln
4.08%
jan 1, 2003
26.786 bln
+1.489 bln
5.89%
jan 1, 2004
28.506 bln
+1.72 bln
6.42%
jan 1, 2005
30.912 bln
+2.405 bln
8.44%
jan 1, 2006
33.722 bln
+2.81 bln
9.09%
jan 1, 2007
36.505 bln
+2.783 bln
8.25%
jan 1, 2008
38.018 bln
+1.514 bln
4.15%
jan 1, 2009
40.326 bln
+2.308 bln
6.07%
jan 1, 2010
34.852 bln
-5.474 bln
-13.57%
jan 1, 2011
35.885 bln
+1.033 bln
2.96%
jan 1, 2012
38.15 bln
+2.265 bln
6.31%
jan 1, 2013
38.973 bln
+823.3 mln
2.16%
jan 1, 2014
38.731 bln
-242.1 mln
-0.62%
jan 1, 2015
39.431 bln
+699.8 mln
1.81%
jan 1, 2016
42.052 bln
+2.622 bln
6.65%
Ranking of countries by current statistics by years


Comments: