29
/
en
AIzaSyAYiBZKx7MnpbEhh9jyipgxe19OcubqV5w
April 1, 2024
227790
Qatar
QAT
true
2
1
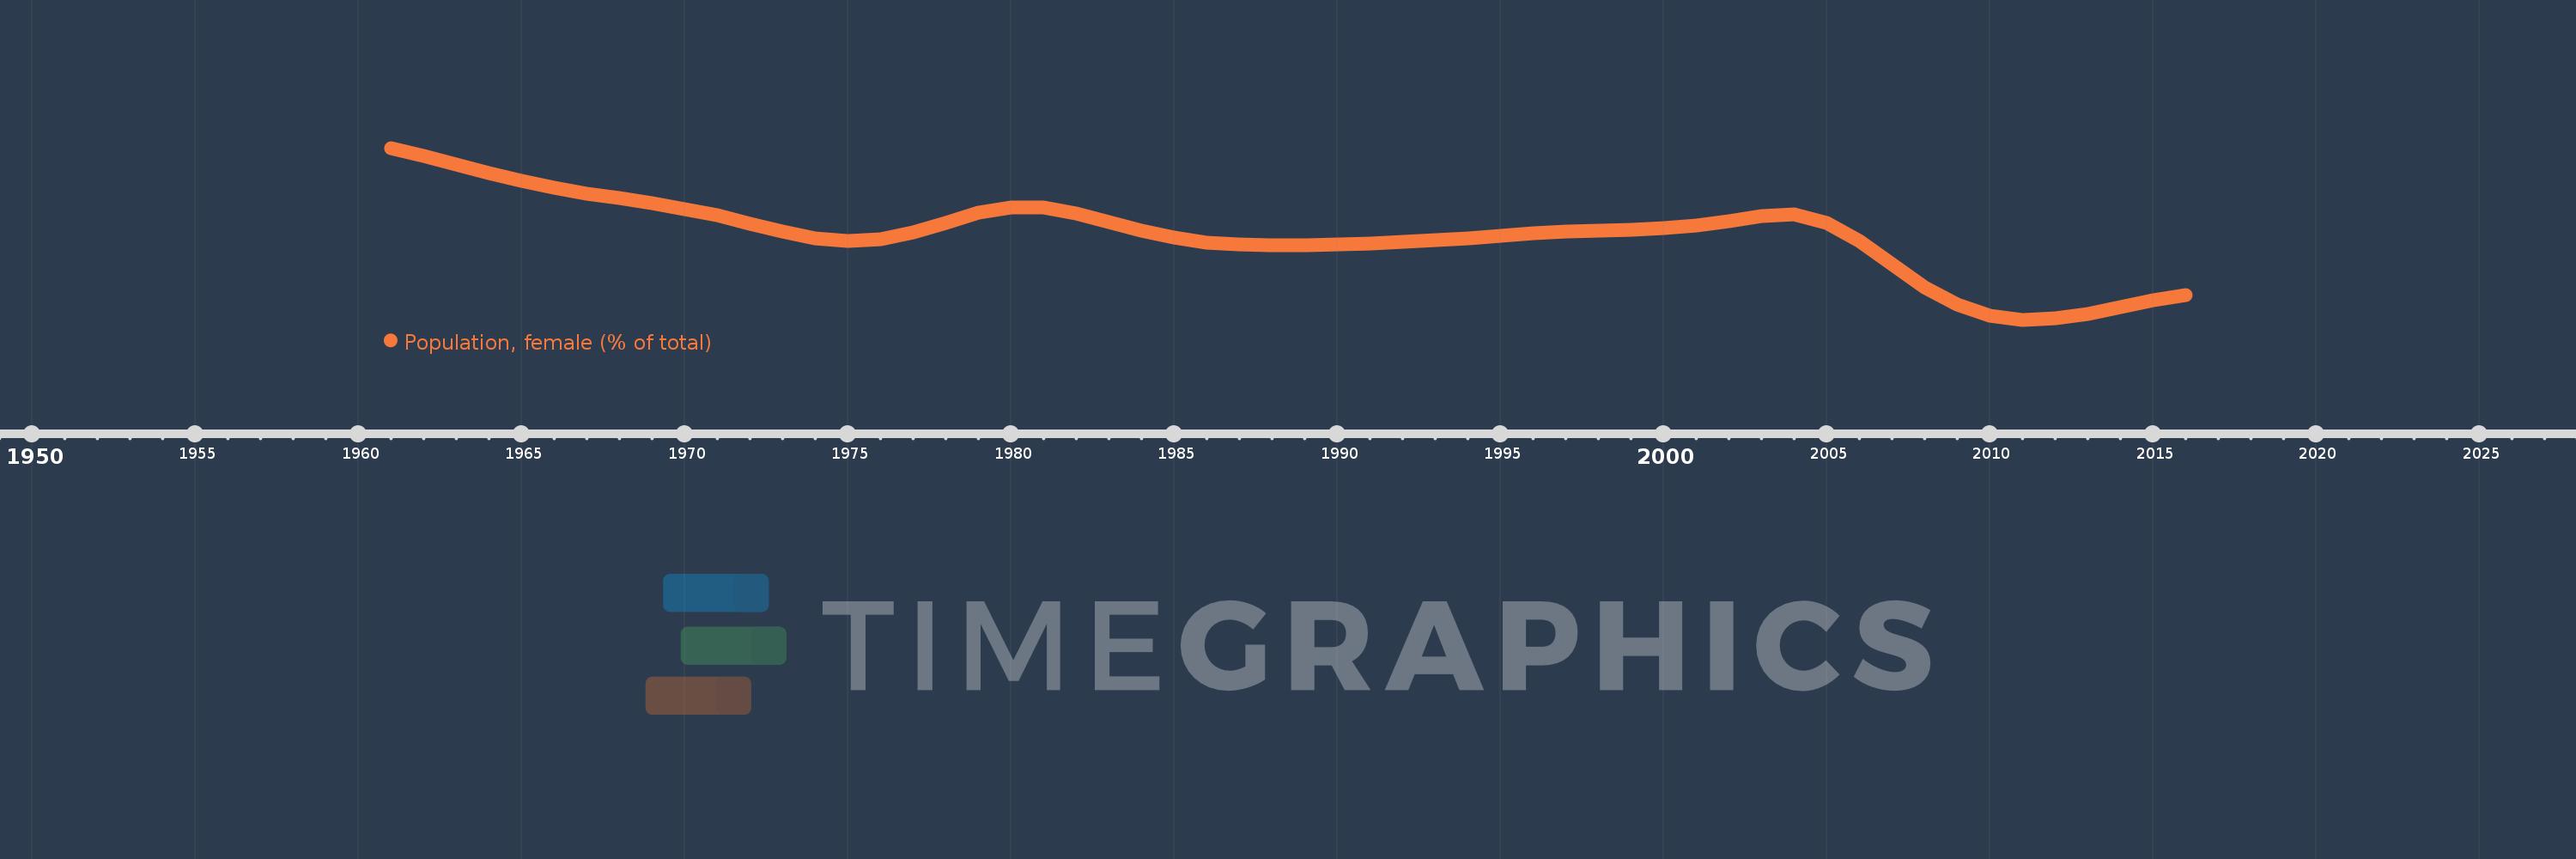
Population, female (% of total)
2016,2015,2014,2013,2012,2011,2010,2009,2008,2007,2006,2005,2004,2003,2002,2001,2000,1999,1998,1997,1996,1995,1994,1993,1992,1991,1990,1989,1988,1987,1986,1985,1984,1983,1982,1981,1980,1979,1978,1977,1976,1975,1974,1973,1972,1971,1970,1969,1968,1967,1966,1965,1964,1963,1962,1961
This statistics in other country:
AfghanistanAlbaniaAlgeriaAngolaAntigua and BarbudaArab WorldArgentinaArmeniaArubaAustraliaAustriaAzerbaijanBahamas, TheBahrainBangladeshBarbadosBelarusBelgiumBelizeBeninBhutanBoliviaBosnia and HerzegovinaBotswanaBrazilBrunei DarussalamBulgariaBurkina FasoBurundiCabo VerdeCambodiaCameroonCanadaCaribbean small statesCentral African RepublicCentral Europe and the BalticsChadChannel IslandsChileChinaColombiaComorosCongo, Dem. Rep.Congo, Rep.Costa RicaCote d'IvoireCroatiaCubaCuracaoCyprusCzech RepublicDenmarkDjiboutiDominican RepublicEarly-demographic dividendEast Asia & PacificEast Asia & Pacific (excluding high income)East Asia & Pacific (IDA & IBRD countries)EcuadorEgypt, Arab Rep.El SalvadorEquatorial GuineaEritreaEstoniaEthiopiaEuro areaEurope & Central AsiaEurope & Central Asia (excluding high income)Europe & Central Asia (IDA & IBRD countries)European UnionFijiFinlandFragile and conflict affected situationsFranceFrench PolynesiaGabonGambia, TheGeorgiaGermanyGhanaGreeceGrenadaGuamGuatemalaGuineaGuinea-BissauGuyanaHaitiHeavily indebted poor countries (HIPC)High incomeHondurasHong Kong SAR, ChinaHungaryIBRD onlyIcelandIDA & IBRD totalIDA blendIDA onlyIDA totalIndiaIndonesiaIran, Islamic Rep.IraqIrelandIsraelItalyJamaicaJapanJordanKazakhstanKenyaKiribatiKorea, Dem. People’s Rep.Korea, Rep.KosovoKuwaitKyrgyz RepublicLao PDRLate-demographic dividendLatin America & Caribbean Latin America & Caribbean (excluding high income)Latin America & the Caribbean (IDA & IBRD countries)LatviaLeast developed countries: UN classificationLebanonLesothoLiberiaLibyaLithuaniaLow & middle incomeLow incomeLower middle incomeLuxembourgMacao SAR, ChinaMacedonia, FYRMadagascarMalawiMalaysiaMaldivesMaliMaltaMauritaniaMauritiusMexicoMicronesia, Fed. Sts.Middle East & North AfricaMiddle East & North Africa (excluding high income)Middle East & North Africa (IDA & IBRD countries)Middle incomeMoldovaMongoliaMontenegroMoroccoMozambiqueMyanmarNamibiaNepalNetherlandsNew CaledoniaNew ZealandNicaraguaNigerNigeriaNorth AmericaNorwayOECD membersOmanOther small statesPacific island small statesPakistanPanamaPapua New GuineaParaguayPeruPhilippinesPolandPortugalPost-demographic dividendPre-demographic dividendPuerto RicoQatarRomaniaRussian FederationRwandaSamoaSao Tome and PrincipeSaudi ArabiaSenegalSerbiaSeychellesSierra LeoneSingaporeSlovak RepublicSloveniaSmall statesSolomon IslandsSomaliaSouth AfricaSouth AsiaSouth Asia (IDA & IBRD)South SudanSpainSri LankaSt. LuciaSt. Vincent and the GrenadinesSub-Saharan Africa Sub-Saharan Africa (excluding high income)Sub-Saharan Africa (IDA & IBRD countries)SudanSurinameSwazilandSwedenSwitzerlandSyrian Arab RepublicTajikistanTanzaniaThailandTimor-LesteTogoTongaTrinidad and TobagoTunisiaTurkeyTurkmenistanUgandaUkraineUnited Arab EmiratesUnited KingdomUnited StatesUpper middle incomeUruguayUzbekistanVanuatuVenezuela, RBVietnamVirgin Islands (U.S.)West Bank and GazaWorldYemen, Rep.ZambiaZimbabwe Timeline:
This timeline shows a graph from 1961 to 2016 of Qatar. No data until 1960. Number of actual observations by date: 56.
Source name:
World Development Indicators
Source organization:
World Bank staff estimates based on male/female distributions of United Nations Population Division's World Population Prospects.
Categories, topics:
Health
Last updated:
apr 23, 2017
Indicators value changes by year
Maximum:
43.501
jan 1, 1961
At the date of observation
Value
Absolute change
Change from previous value
jan 1, 1961
43.501
+43.501
0.0%
jan 1, 1962
42.644
-0.857
-1.97%
jan 1, 1963
41.698
-0.946
-2.22%
jan 1, 1964
40.756
-0.942
-2.26%
jan 1, 1965
39.891
-0.866
-2.12%
jan 1, 1966
39.125
-0.765
-1.92%
jan 1, 1967
38.493
-0.633
-1.62%
jan 1, 1968
37.96
-0.532
-1.38%
jan 1, 1969
37.431
-0.529
-1.39%
jan 1, 1970
36.811
-0.62
-1.66%
jan 1, 1971
36.086
-0.726
-1.97%
jan 1, 1972
35.207
-0.879
-2.43%
jan 1, 1973
34.284
-0.923
-2.62%
jan 1, 1974
33.565
-0.72
-2.1%
jan 1, 1975
33.276
-0.288
-0.86%
jan 1, 1976
33.486
+0.209
0.63%
jan 1, 1977
34.214
+0.728
2.18%
jan 1, 1978
35.293
+1.078
3.15%
jan 1, 1979
36.368
+1.075
3.05%
jan 1, 1980
36.999
+0.631
1.73%
jan 1, 1981
36.968
-0.031
-0.08%
jan 1, 1982
36.333
-0.635
-1.72%
jan 1, 1983
35.382
-0.95
-2.62%
jan 1, 1984
34.404
-0.978
-2.76%
jan 1, 1985
33.63
-0.774
-2.25%
jan 1, 1986
33.139
-0.491
-1.46%
jan 1, 1987
32.893
-0.247
-0.74%
jan 1, 1988
32.808
-0.085
-0.26%
jan 1, 1989
32.837
+0.029
0.09%
jan 1, 1990
32.929
+0.091
0.28%
jan 1, 1991
33.05
+0.122
0.37%
jan 1, 1992
33.195
+0.145
0.44%
jan 1, 1993
33.373
+0.178
0.53%
jan 1, 1994
33.585
+0.212
0.64%
jan 1, 1995
33.833
+0.248
0.74%
jan 1, 1996
34.107
+0.274
0.81%
jan 1, 1997
34.328
+0.221
0.65%
jan 1, 1998
34.459
+0.131
0.38%
jan 1, 1999
34.564
+0.105
0.31%
jan 1, 2000
34.732
+0.168
0.49%
jan 1, 2001
34.978
+0.245
0.71%
jan 1, 2002
35.456
+0.479
1.37%
jan 1, 2003
36.044
+0.587
1.66%
jan 1, 2004
36.181
+0.137
0.38%
jan 1, 2005
35.268
-0.913
-2.52%
jan 1, 2006
33.323
-1.945
-5.51%
jan 1, 2007
30.753
-2.57
-7.71%
jan 1, 2008
28.242
-2.512
-8.17%
jan 1, 2009
26.289
-1.953
-6.92%
jan 1, 2010
25.109
-1.18
-4.49%
jan 1, 2011
24.65
-0.46
-1.83%
jan 1, 2012
24.776
+0.127
0.51%
jan 1, 2013
25.297
+0.52
2.1%
jan 1, 2014
26.03
+0.733
2.9%
jan 1, 2015
26.765
+0.735
2.82%
jan 1, 2016
27.362
+0.597
2.23%
Ranking of countries by current statistics by years


Comments: