29
/
en
AIzaSyAYiBZKx7MnpbEhh9jyipgxe19OcubqV5w
April 1, 2024
227429
Qatar
QAT
true
2
1
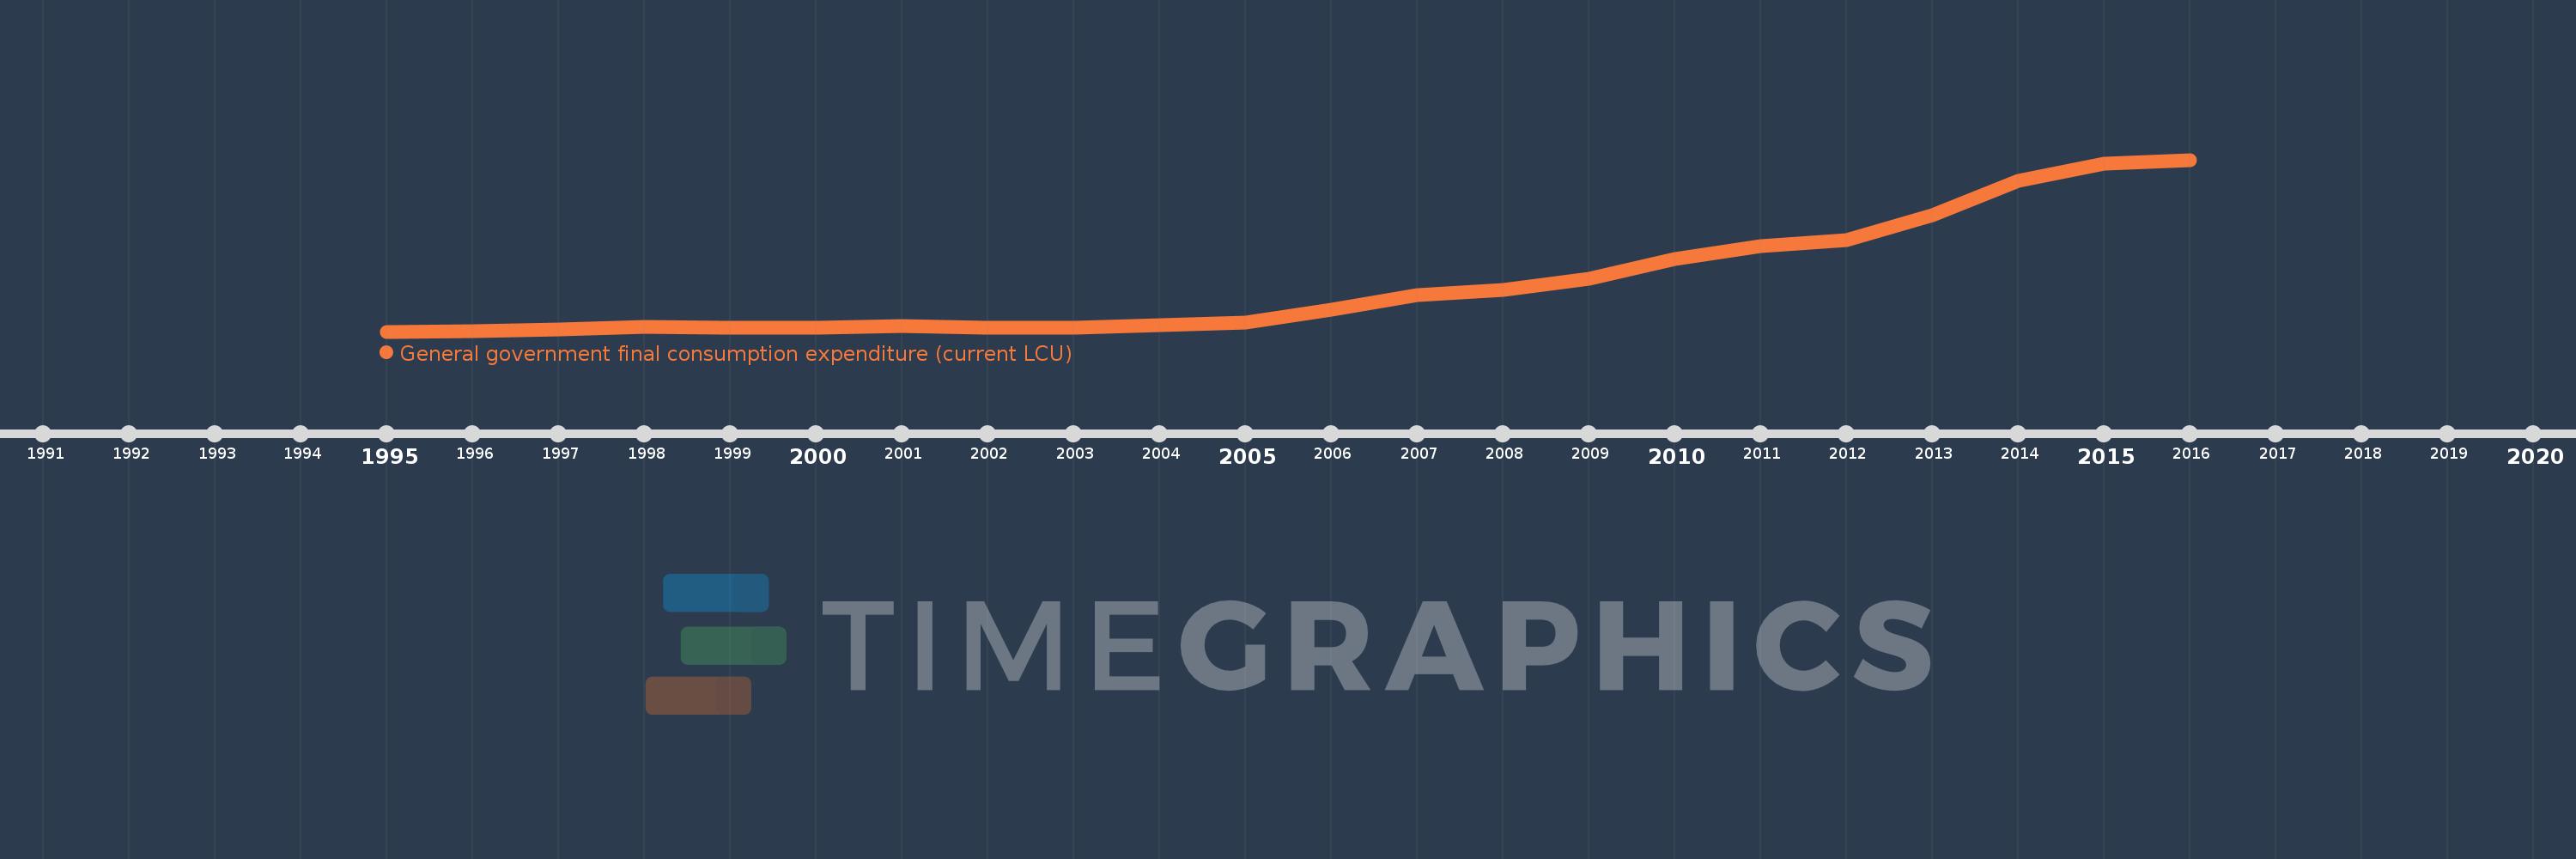
General government final consumption expenditure (current LCU)
2016,2015,2014,2013,2012,2011,2010,2009,2008,2007,2006,2005,2004,2003,2002,2001,2000,1999,1998,1997,1996,1995
This statistics in other country:
AfghanistanAlbaniaAlgeriaAngolaAntigua and BarbudaArgentinaArmeniaArubaAustraliaAustriaAzerbaijanBahamas, TheBahrainBangladeshBarbadosBelarusBelgiumBelizeBeninBermudaBhutanBoliviaBosnia and HerzegovinaBotswanaBrazilBrunei DarussalamBulgariaBurkina FasoBurundiCabo VerdeCambodiaCameroonCanadaCentral African RepublicChadChileChinaColombiaComorosCongo, Dem. Rep.Congo, Rep.Costa RicaCote d'IvoireCroatiaCubaCyprusCzech RepublicDenmarkDjiboutiDominicaDominican RepublicEcuadorEgypt, Arab Rep.El SalvadorEquatorial GuineaEritreaEstoniaEthiopiaFaroe IslandsFijiFinlandFranceFrench PolynesiaGabonGambia, TheGeorgiaGermanyGhanaGreeceGrenadaGuatemalaGuineaGuinea-BissauGuyanaHaitiHondurasHong Kong SAR, ChinaHungaryIcelandIndiaIndonesiaIran, Islamic Rep.IraqIrelandIsraelItalyJamaicaJapanJordanKazakhstanKenyaKiribatiKorea, Rep.KosovoKuwaitKyrgyz RepublicLao PDRLatviaLebanonLesothoLiberiaLibyaLithuaniaLuxembourgMacao SAR, ChinaMacedonia, FYRMadagascarMalawiMalaysiaMaldivesMaliMaltaMauritaniaMauritiusMexicoMicronesia, Fed. Sts.MoldovaMongoliaMontenegroMoroccoMozambiqueNamibiaNepalNetherlandsNew CaledoniaNew ZealandNicaraguaNigerNigeriaNorwayOmanPakistanPanamaPapua New GuineaParaguayPeruPhilippinesPolandPortugalPuerto RicoQatarRomaniaRussian FederationRwandaSaudi ArabiaSenegalSerbiaSeychellesSierra LeoneSingaporeSlovak RepublicSloveniaSolomon IslandsSomaliaSouth AfricaSouth SudanSpainSri LankaSt. Kitts and NevisSt. LuciaSt. Vincent and the GrenadinesSudanSurinameSwazilandSwedenSwitzerlandSyrian Arab RepublicTajikistanTanzaniaThailandTimor-LesteTogoTongaTrinidad and TobagoTunisiaTurkeyTurkmenistanUgandaUkraineUnited Arab EmiratesUnited KingdomUnited StatesUruguayUzbekistanVanuatuVenezuela, RBVietnamWest Bank and GazaYemen, Rep.ZambiaZimbabwe Timeline:
This timeline shows a graph from 1995 to 2016 of Qatar. No data until 1994. Number of actual observations by date: 22.
Source name:
World Development Indicators
Source organization:
World Bank national accounts data, and OECD National Accounts data files.
Categories, topics:
Economy & Growth
Last updated:
apr 23, 2017
Indicators value changes by year
Minimum:
9.25 bln
jan 1, 1995
Maximum:
118.47 bln
jan 1, 2016
At the date of observation
Value
Absolute change
Change from previous value
jan 1, 1995
9.25 bln
+9.25 bln
0.0%
jan 1, 1996
9.436 bln
+186.0 mln
2.01%
jan 1, 1997
10.886 bln
+1.45 bln
15.37%
jan 1, 1998
12.236 bln
+1.35 bln
12.4%
jan 1, 1999
11.789 bln
-447.0 mln
-3.65%
jan 1, 2000
11.573 bln
-216.0 mln
-1.83%
jan 1, 2001
12.715 bln
+1.142 bln
9.87%
jan 1, 2002
11.891 bln
-824.0 mln
-6.48%
jan 1, 2003
11.783 bln
-108.0 mln
-0.91%
jan 1, 2004
13.197 bln
+1.414 bln
12.0%
jan 1, 2005
15.094 bln
+1.897 bln
14.37%
jan 1, 2006
23.172 bln
+8.078 bln
53.52%
jan 1, 2007
32.616 bln
+9.444 bln
40.76%
jan 1, 2008
35.99 bln
+3.374 bln
10.34%
jan 1, 2009
42.696 bln
+6.706 bln
18.63%
jan 1, 2010
55.652 bln
+12.956 bln
30.34%
jan 1, 2011
63.689 bln
+8.037 bln
14.44%
jan 1, 2012
67.416 bln
+3.727 bln
5.85%
jan 1, 2013
83.298 bln
+15.882 bln
23.56%
jan 1, 2014
105.292 bln
+21.994 bln
26.4%
jan 1, 2015
116.105 bln
+10.813 bln
10.27%
jan 1, 2016
118.47 bln
+2.365 bln
2.04%
Ranking of countries by current statistics by years


Comments: