29
/
en
AIzaSyAYiBZKx7MnpbEhh9jyipgxe19OcubqV5w
April 1, 2024
226062
Portugal
PRT
true
2
1
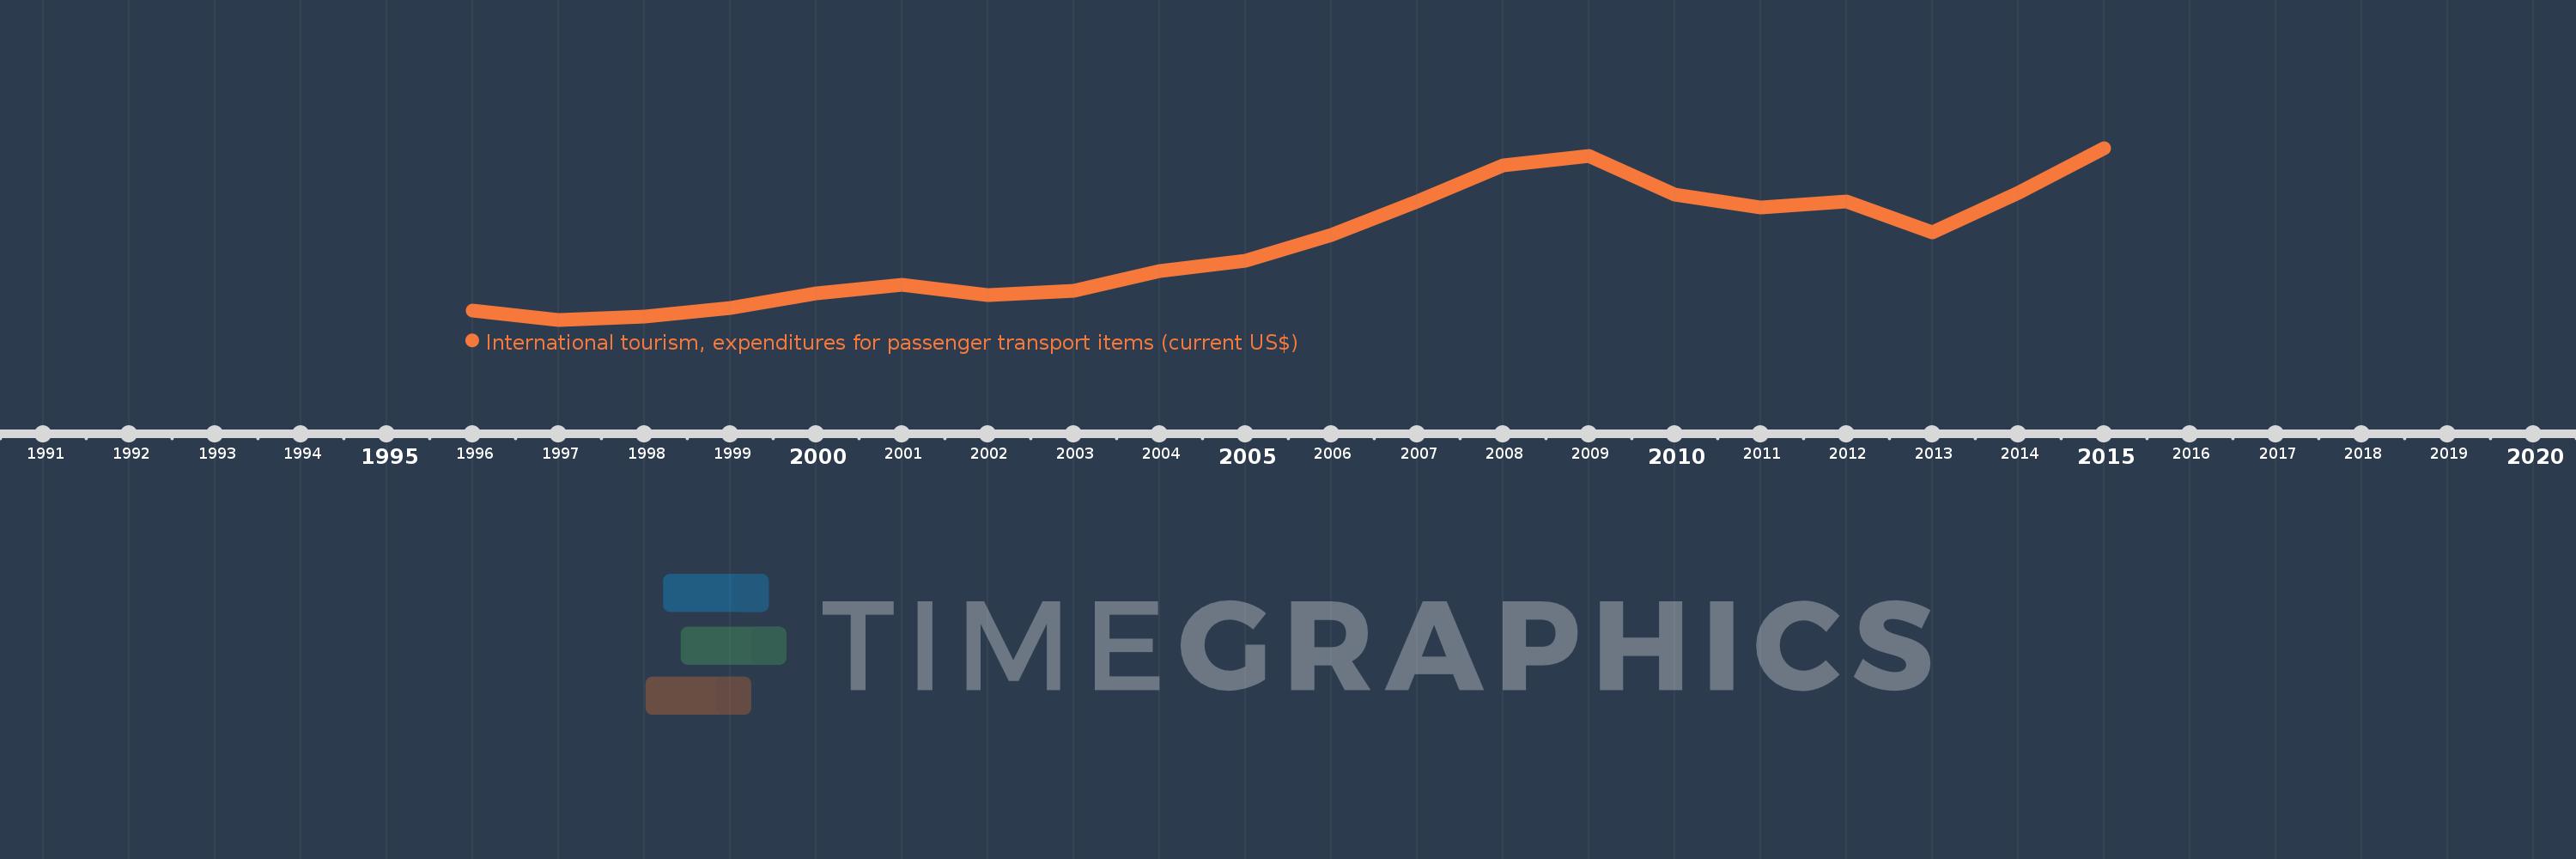
International tourism, expenditures for passenger transport items (current US$)
2015,2014,2013,2012,2011,2010,2009,2008,2007,2006,2005,2004,2003,2002,2001,2000,1999,1998,1997,1996
This statistics in other country:
AfghanistanAlbaniaAlgeriaAngolaArab WorldArgentinaArmeniaArubaAustraliaAustriaAzerbaijanBahamas, TheBahrainBangladeshBarbadosBelarusBelgiumBelizeBeninBermudaBhutanBoliviaBosnia and HerzegovinaBotswanaBrazilBulgariaBurkina FasoBurundiCabo VerdeCambodiaCameroonCanadaCaribbean small statesCentral African RepublicCentral Europe and the BalticsChileChinaColombiaComorosCongo, Rep.Costa RicaCote d'IvoireCroatiaCuracaoCyprusCzech RepublicDjiboutiDominican RepublicEarly-demographic dividendEast Asia & PacificEast Asia & Pacific (excluding high income)East Asia & Pacific (IDA & IBRD countries)EcuadorEgypt, Arab Rep.El SalvadorEstoniaEthiopiaEuro areaEurope & Central AsiaEurope & Central Asia (excluding high income)Europe & Central Asia (IDA & IBRD countries)European UnionFijiFinlandFragile and conflict affected situationsFranceFrench PolynesiaGabonGambia, TheGeorgiaGermanyGhanaGreeceGuatemalaGuineaGuinea-BissauGuyanaHaitiHeavily indebted poor countries (HIPC)High incomeHondurasHungaryIBRD onlyIcelandIDA & IBRD totalIDA onlyIndiaIndonesiaIran, Islamic Rep.IraqIrelandIsraelItalyJamaicaJapanJordanKazakhstanKenyaKiribatiKorea, Rep.KuwaitKyrgyz RepublicLao PDRLate-demographic dividendLatin America & Caribbean Latin America & Caribbean (excluding high income)Latin America & the Caribbean (IDA & IBRD countries)LatviaLeast developed countries: UN classificationLebanonLesothoLiberiaLibyaLithuaniaLow & middle incomeLow incomeLuxembourgMacao SAR, ChinaMacedonia, FYRMadagascarMalawiMalaysiaMaldivesMaliMaltaMarshall IslandsMauritaniaMauritiusMexicoMicronesia, Fed. Sts.Middle East & North AfricaMiddle East & North Africa (excluding high income)Middle East & North Africa (IDA & IBRD countries)Middle incomeMoldovaMongoliaMontenegroMoroccoMozambiqueMyanmarNepalNetherlandsNicaraguaNigerNigeriaNorth AmericaNorwayOECD membersOmanPacific island small statesPakistanPalauPanamaPapua New GuineaParaguayPeruPhilippinesPolandPortugalPost-demographic dividendPre-demographic dividendPuerto RicoQatarRomaniaRussian FederationRwandaSamoaSao Tome and PrincipeSaudi ArabiaSenegalSerbiaSeychellesSierra LeoneSint Maarten (Dutch part)Slovak RepublicSloveniaSolomon IslandsSouth AfricaSpainSri LankaSub-Saharan Africa Sub-Saharan Africa (excluding high income)Sub-Saharan Africa (IDA & IBRD countries)SurinameSwazilandSwedenSwitzerlandSyrian Arab RepublicTajikistanTanzaniaThailandTimor-LesteTogoTongaTrinidad and TobagoTunisiaTurkeyTurkmenistanTuvaluUgandaUkraineUnited KingdomUnited StatesUpper middle incomeUruguayVanuatuVenezuela, RBWest Bank and GazaWorldYemen, Rep.Zambia Timeline:
This timeline shows a graph from 1996 to 2015 of Portugal. No data until 1995. Number of actual observations by date: 20.
Source name:
World Development Indicators
Source organization:
World Tourism Organization, Yearbook of Tourism Statistics, Compendium of Tourism Statistics and data files.
Categories, topics:
Private Sector, Trade
Last updated:
apr 23, 2017
Indicators value changes by year
Minimum:
409.0 mln
jan 1, 1997
Maximum:
984.0 mln
jan 1, 2015
At the date of observation
Value
Absolute change
Change from previous value
jan 1, 1996
440.0 mln
+440.0 mln
0.0%
jan 1, 1997
409.0 mln
-31.0 mln
-7.05%
jan 1, 1998
421.0 mln
+12.0 mln
2.93%
jan 1, 1999
447.0 mln
+26.0 mln
6.18%
jan 1, 2000
497.0 mln
+50.0 mln
11.19%
jan 1, 2001
526.0 mln
+29.0 mln
5.84%
jan 1, 2002
492.0 mln
-34.0 mln
-6.46%
jan 1, 2003
506.0 mln
+14.0 mln
2.85%
jan 1, 2004
573.0 mln
+67.0 mln
13.24%
jan 1, 2005
606.0 mln
+33.0 mln
5.76%
jan 1, 2006
692.0 mln
+86.0 mln
14.19%
jan 1, 2007
806.0 mln
+114.0 mln
16.47%
jan 1, 2008
927.0 mln
+121.0 mln
15.01%
jan 1, 2009
958.0 mln
+31.0 mln
3.34%
jan 1, 2010
828.0 mln
-130.0 mln
-13.57%
jan 1, 2011
786.0 mln
-42.0 mln
-5.07%
jan 1, 2012
804.0 mln
+18.0 mln
2.29%
jan 1, 2013
701.0 mln
-103.0 mln
-12.81%
jan 1, 2014
834.0 mln
+133.0 mln
18.97%
jan 1, 2015
984.0 mln
+150.0 mln
17.99%
Ranking of countries by current statistics by years


Comments: