29
/
en
AIzaSyAYiBZKx7MnpbEhh9jyipgxe19OcubqV5w
April 1, 2024
224714
Poland
POL
true
2
1
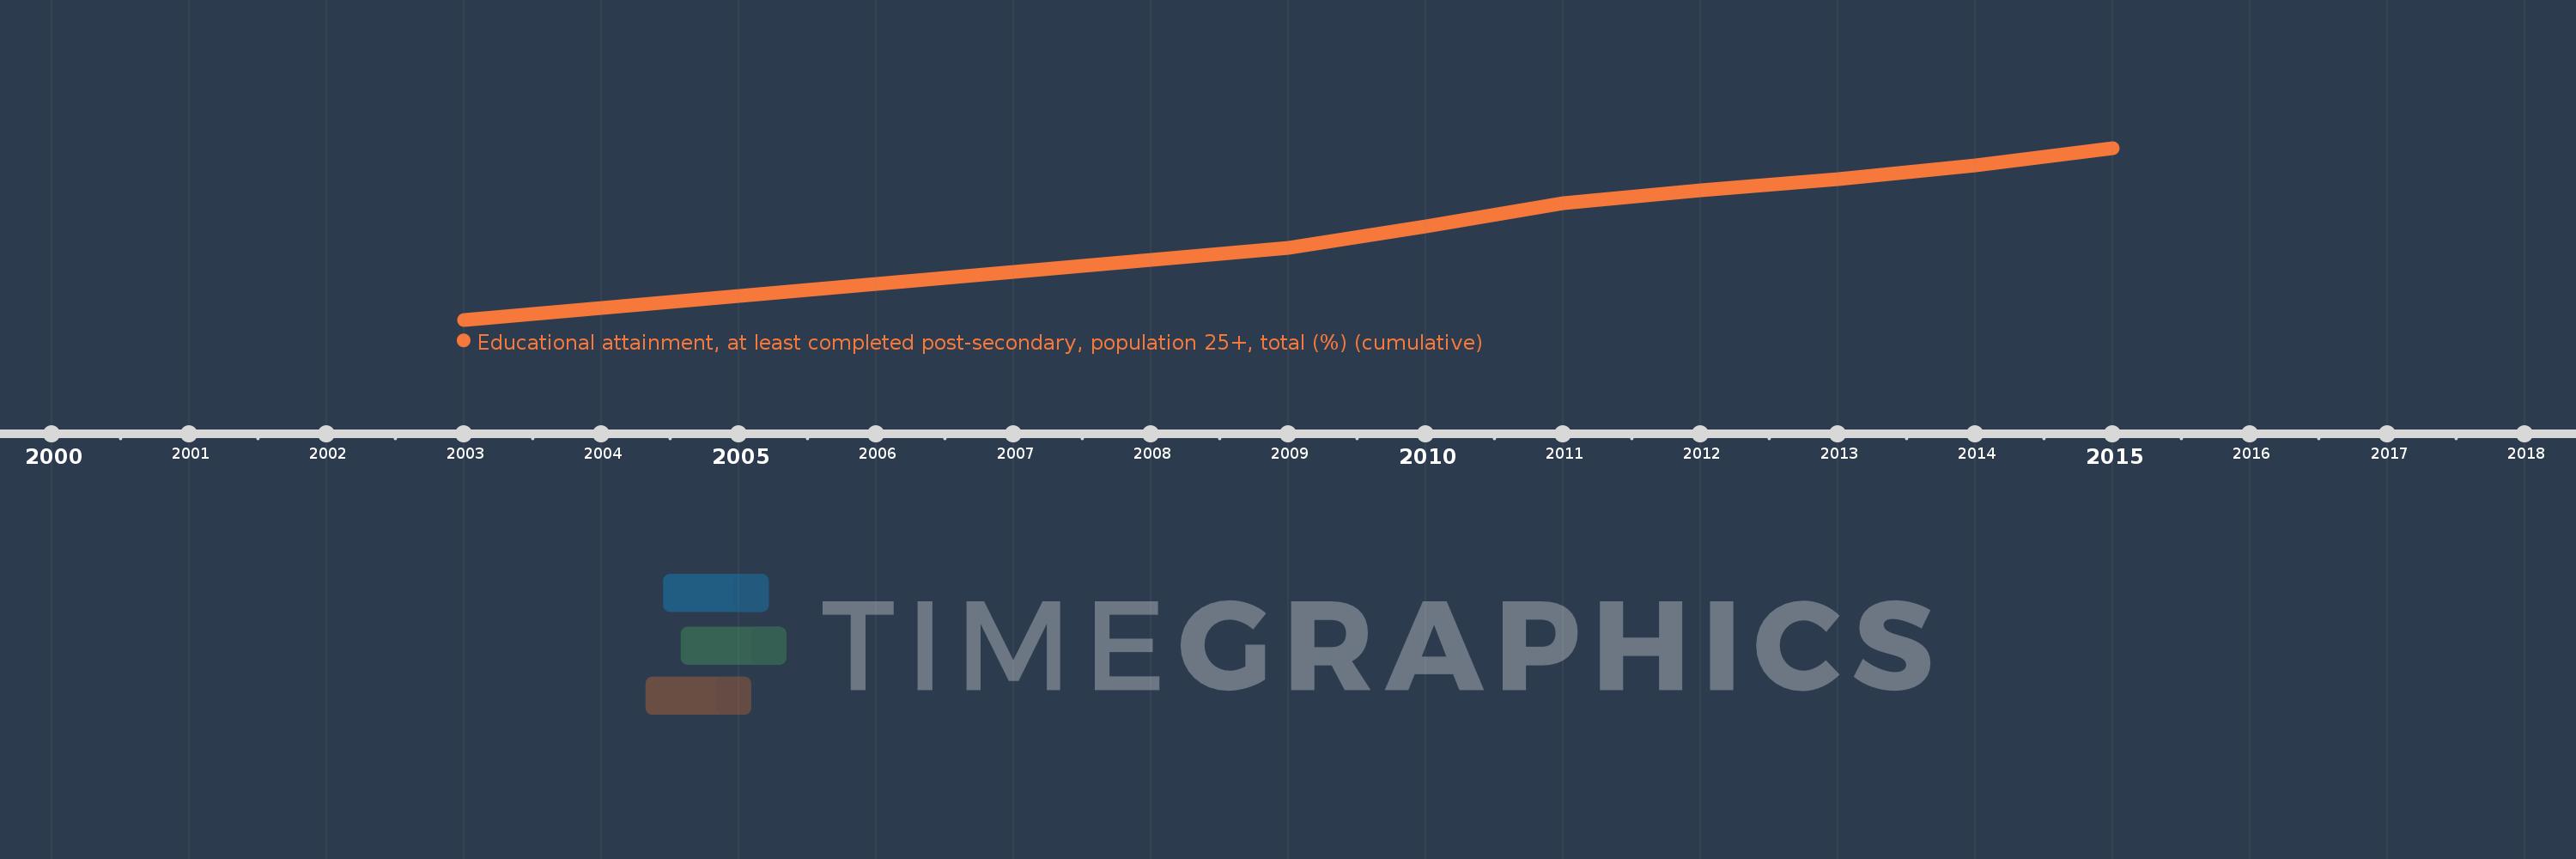
Educational attainment, at least completed post-secondary, population 25+, total (%) (cumulative)
2015,2014,2013,2012,2011,2010,2009,2003
This statistics in other country:
Timeline:
This timeline shows a graph from 2003 to 2015 of Poland. No data until 2002. Number of actual observations by date: 8.
Source name:
World Development Indicators
Source organization:
United Nations Educational, Scientific, and Cultural Organization (UNESCO) Institute for Statistics.
Categories, topics:
Education, Gender
Last updated:
apr 23, 2017
Indicators value changes by year
Maximum:
27.123
jan 1, 2015
At the date of observation
Value
Absolute change
Change from previous value
jan 1, 2003
16.06
+16.06
0.0%
jan 1, 2009
20.667
+4.608
28.69%
jan 1, 2010
22.1
+1.433
6.93%
jan 1, 2011
23.548
+1.448
6.55%
jan 1, 2012
24.403
+0.855
3.63%
jan 1, 2013
25.121
+0.719
2.95%
jan 1, 2014
25.997
+0.876
3.49%
jan 1, 2015
27.123
+1.126
4.33%
Ranking of countries by current statistics by years


Comments: