This statistics in other country:
Timeline:
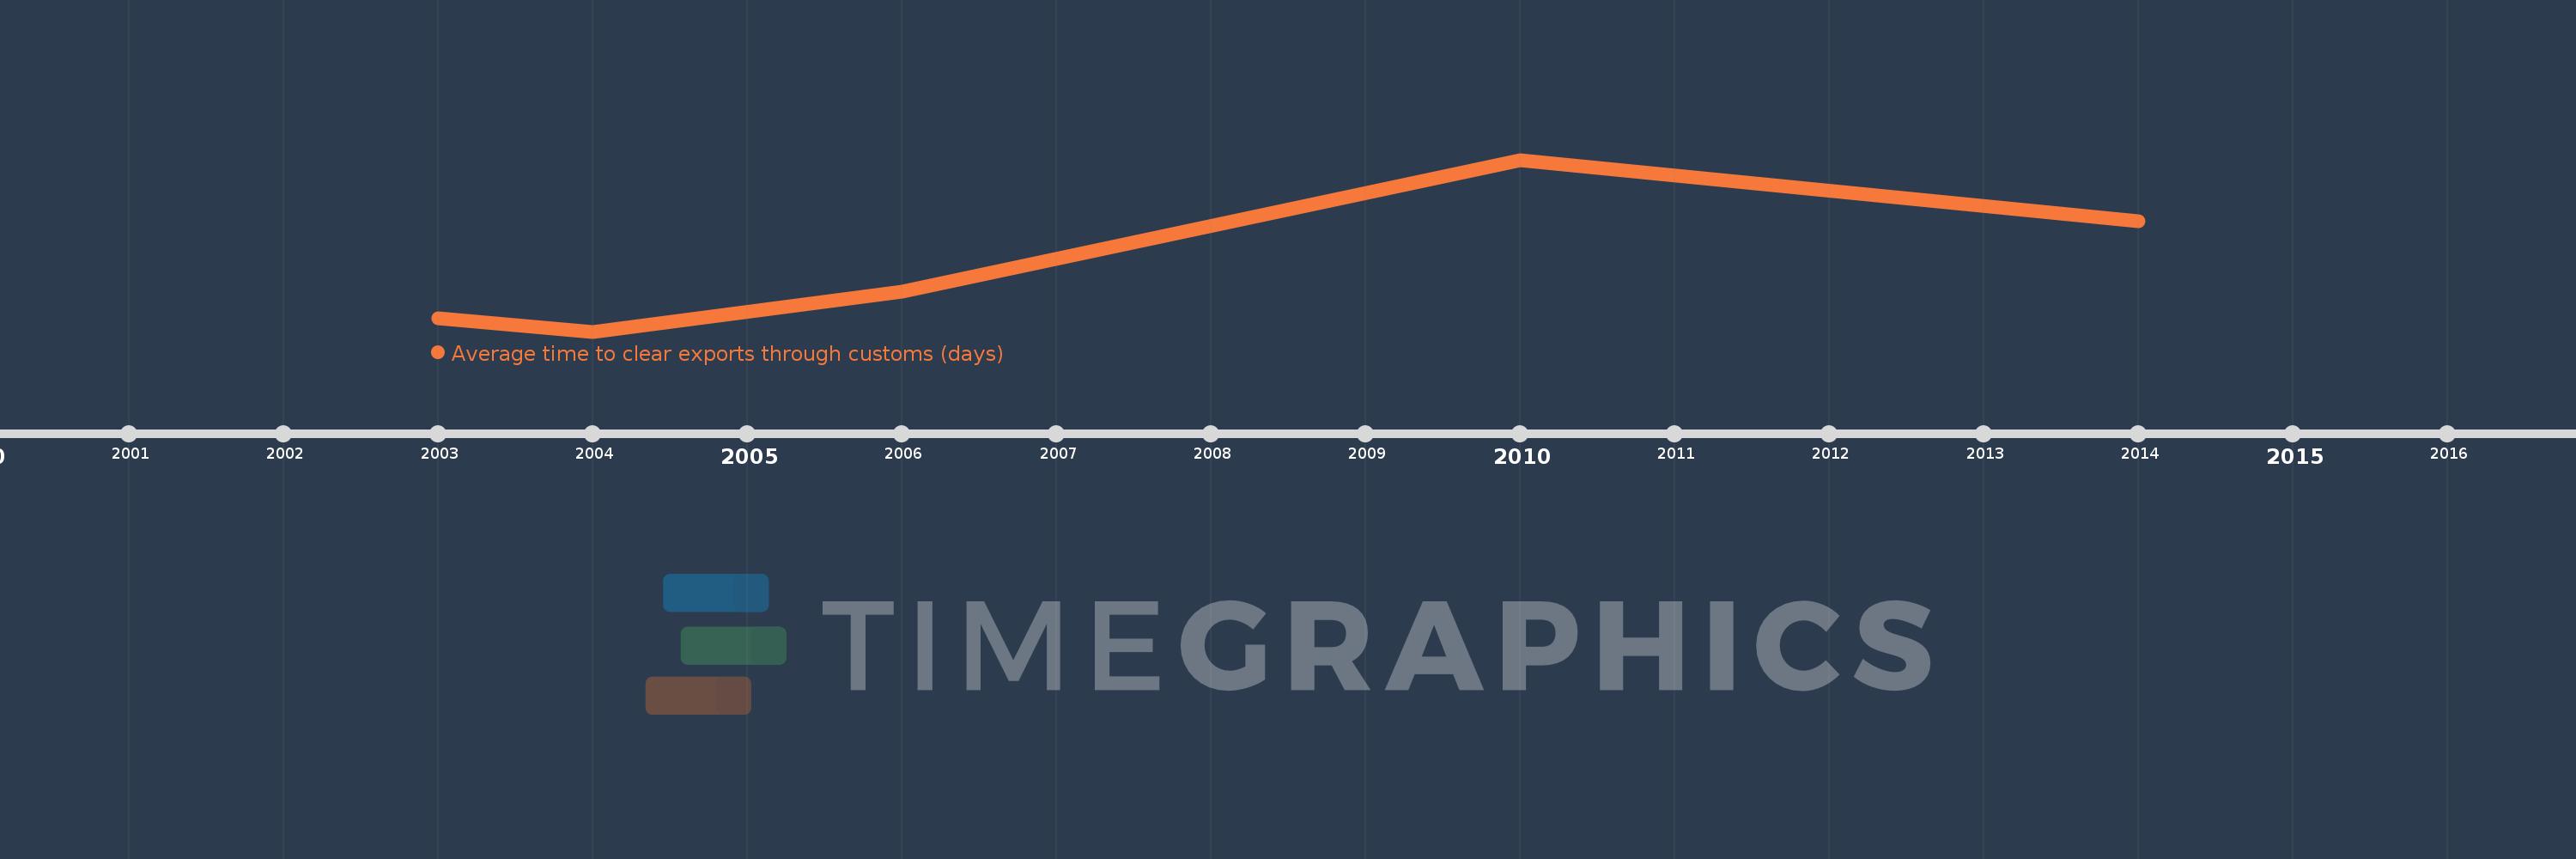
This timeline shows a graph from 2003 to 2014 of Poland. No data until 2002. Number of actual observations by date: 5.
Source name:
World Development Indicators
Source organization:
World Bank, Enterprise Surveys (http://www.enterprisesurveys.org/).
Categories, topics:
Private Sector, Trade
Last updated:
apr 23, 2017
Indicators value changes by year
At the date of observation
Value
Absolute change
Change from previous value
jan 1, 2004
2.1
-0.3
-12.5%
jan 1, 2006
3.0
+0.9
42.86%
jan 1, 2010
6.0
+3.0
100.0%
jan 1, 2014
4.6
-1.4
-23.33%
Ranking of countries by current statistics by years


Comments: