29
/
en
AIzaSyAYiBZKx7MnpbEhh9jyipgxe19OcubqV5w
April 1, 2024
224226
Philippines
PHL
true
2
1
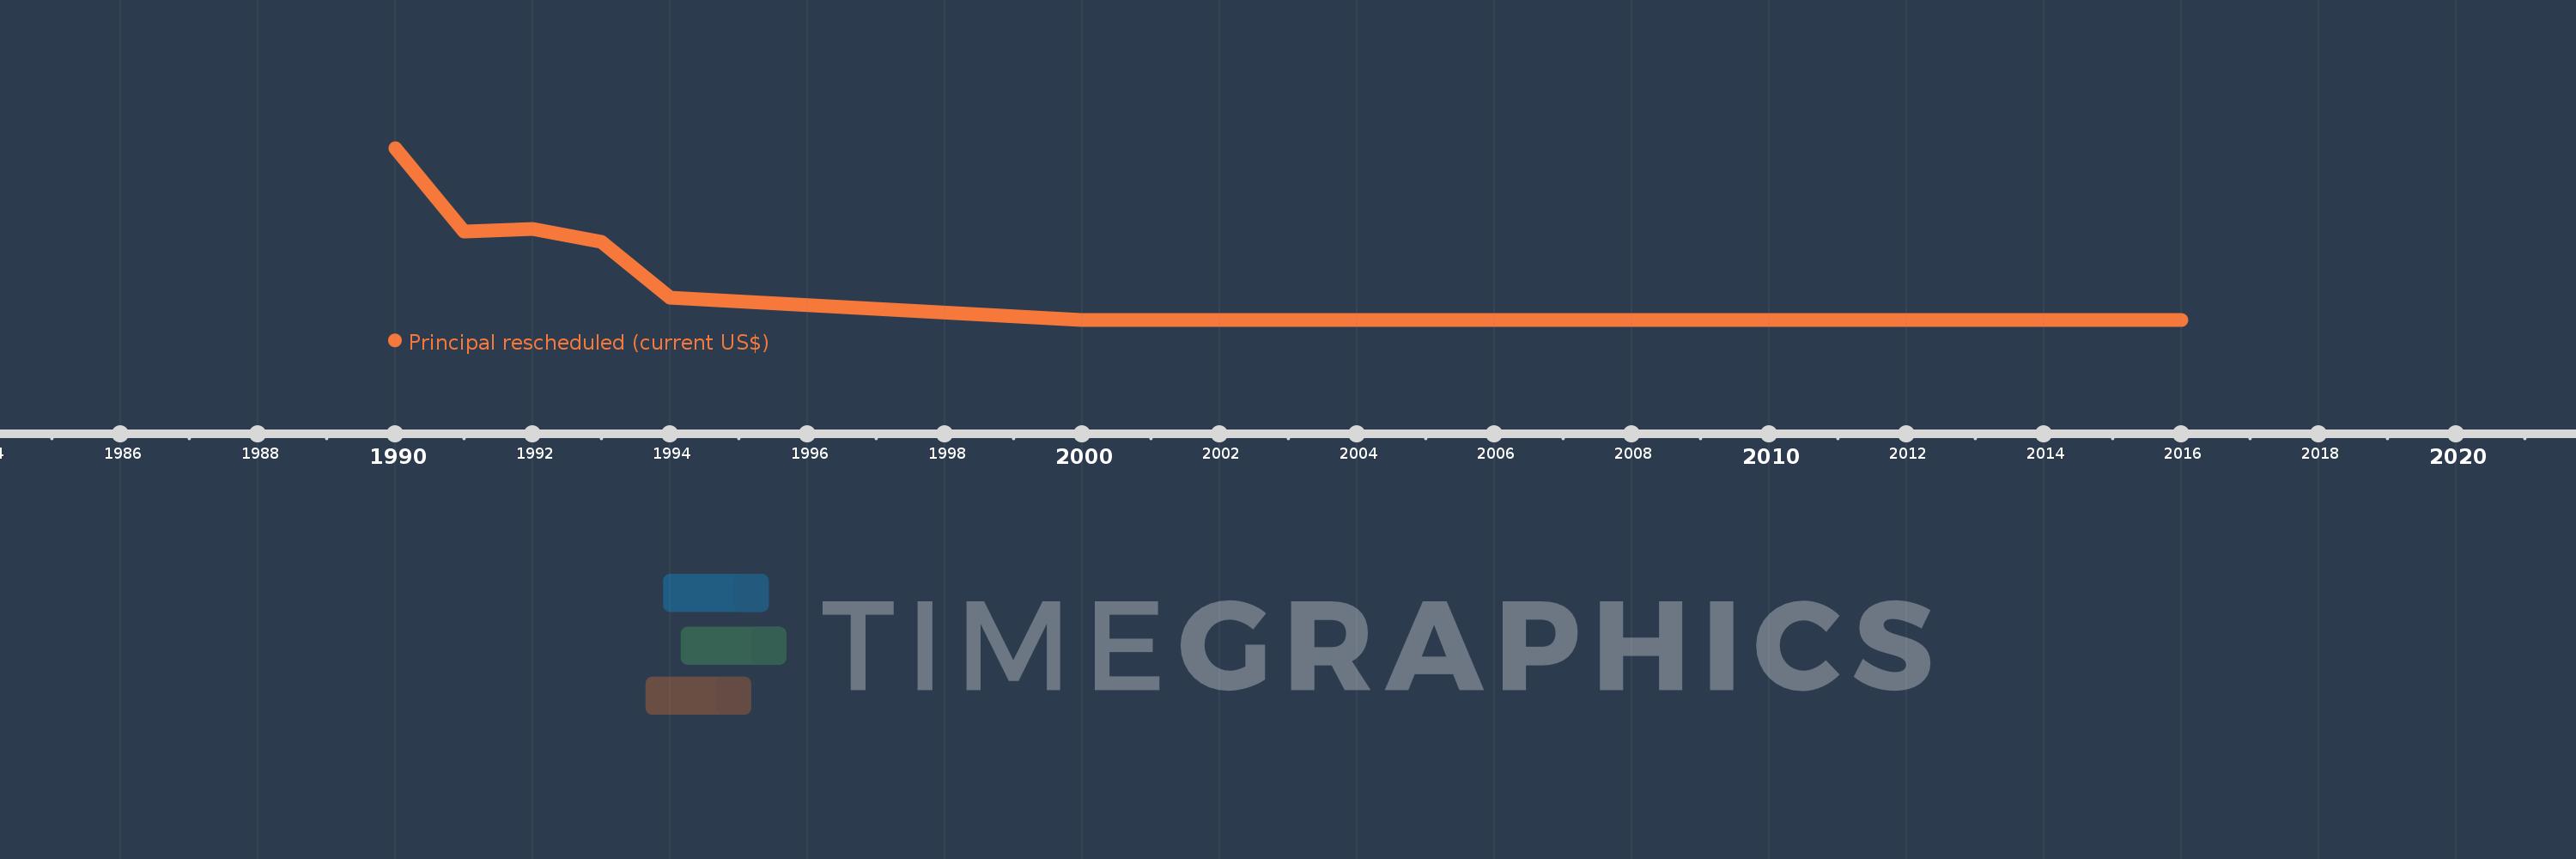
Principal rescheduled (current US$)
2016,2015,2014,2013,2011,2010,2009,2008,2007,2000,1994,1993,1992,1991,1990
This statistics in other country:
Timeline:
This timeline shows a graph from 1990 to 2016 of Philippines. No data until 1989. Number of actual observations by date: 15.
Source name:
World Development Indicators
Source organization:
World Bank, International Debt Statistics.
Categories, topics:
External Debt
Last updated:
apr 23, 2017
Indicators value changes by year
Maximum:
1.657 bln
jan 1, 1990
At the date of observation
Value
Absolute change
Change from previous value
jan 1, 1990
1.657 bln
+1.657 bln
0.0%
jan 1, 1991
847.742 mln
-809.135 mln
-48.83%
jan 1, 1992
872.899 mln
+25.157 mln
2.97%
jan 1, 1993
748.093 mln
-124.806 mln
-14.3%
jan 1, 1994
215.455 mln
-532.638 mln
-71.2%
jan 1, 2000
0.0
-215.455 mln
-100.0%
Ranking of countries by current statistics by years


Comments: