29
/
en
AIzaSyAYiBZKx7MnpbEhh9jyipgxe19OcubqV5w
April 1, 2024
222042
Peru
PER
true
2
1
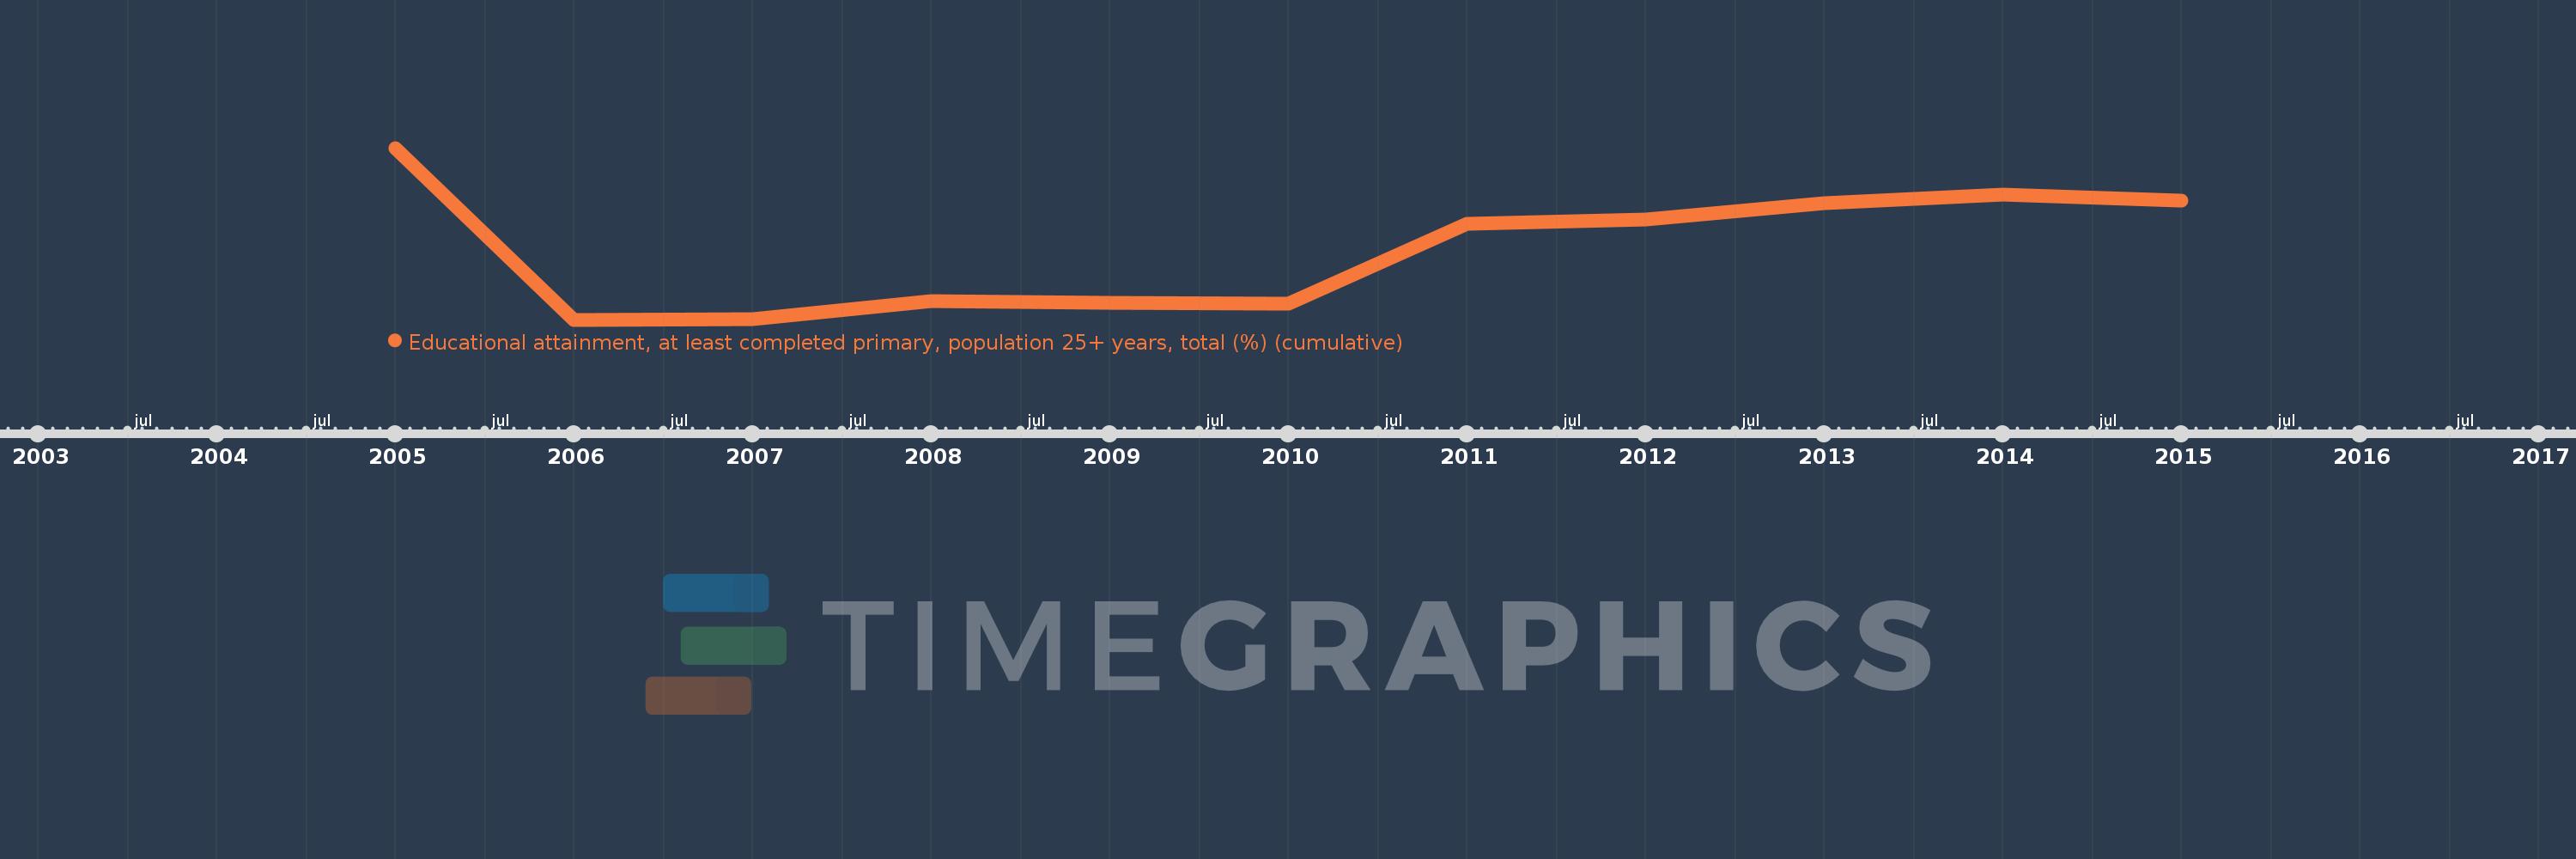
Educational attainment, at least completed primary, population 25+ years, total (%) (cumulative)
2015,2014,2013,2012,2011,2010,2009,2008,2007,2006,2005
This statistics in other country:
Timeline:
This timeline shows a graph from 2005 to 2015 of Peru. No data until 2004. Number of actual observations by date: 11.
Source name:
World Development Indicators
Source organization:
United Nations Educational, Scientific, and Cultural Organization (UNESCO) Institute for Statistics.
Categories, topics:
Education, Gender
Last updated:
apr 23, 2017
Indicators value changes by year
Minimum:
71.086
jan 1, 2006
Maximum:
83.593
jan 1, 2005
At the date of observation
Value
Absolute change
Change from previous value
jan 1, 2005
83.593
+83.593
0.0%
jan 1, 2006
71.086
-12.507
-14.96%
jan 1, 2007
71.145
+0.059
0.08%
jan 1, 2008
72.465
+1.32
1.86%
jan 1, 2009
72.313
-0.152
-0.21%
jan 1, 2010
72.249
-0.064
-0.09%
jan 1, 2011
78.07
+5.821
8.06%
jan 1, 2012
78.405
+0.335
0.43%
jan 1, 2013
79.545
+1.14
1.45%
jan 1, 2014
80.173
+0.628
0.79%
jan 1, 2015
79.778
-0.395
-0.49%
Ranking of countries by current statistics by years


Comments: