29
/
en
AIzaSyAYiBZKx7MnpbEhh9jyipgxe19OcubqV5w
April 1, 2024
220496
Paraguay
PRY
true
2
1
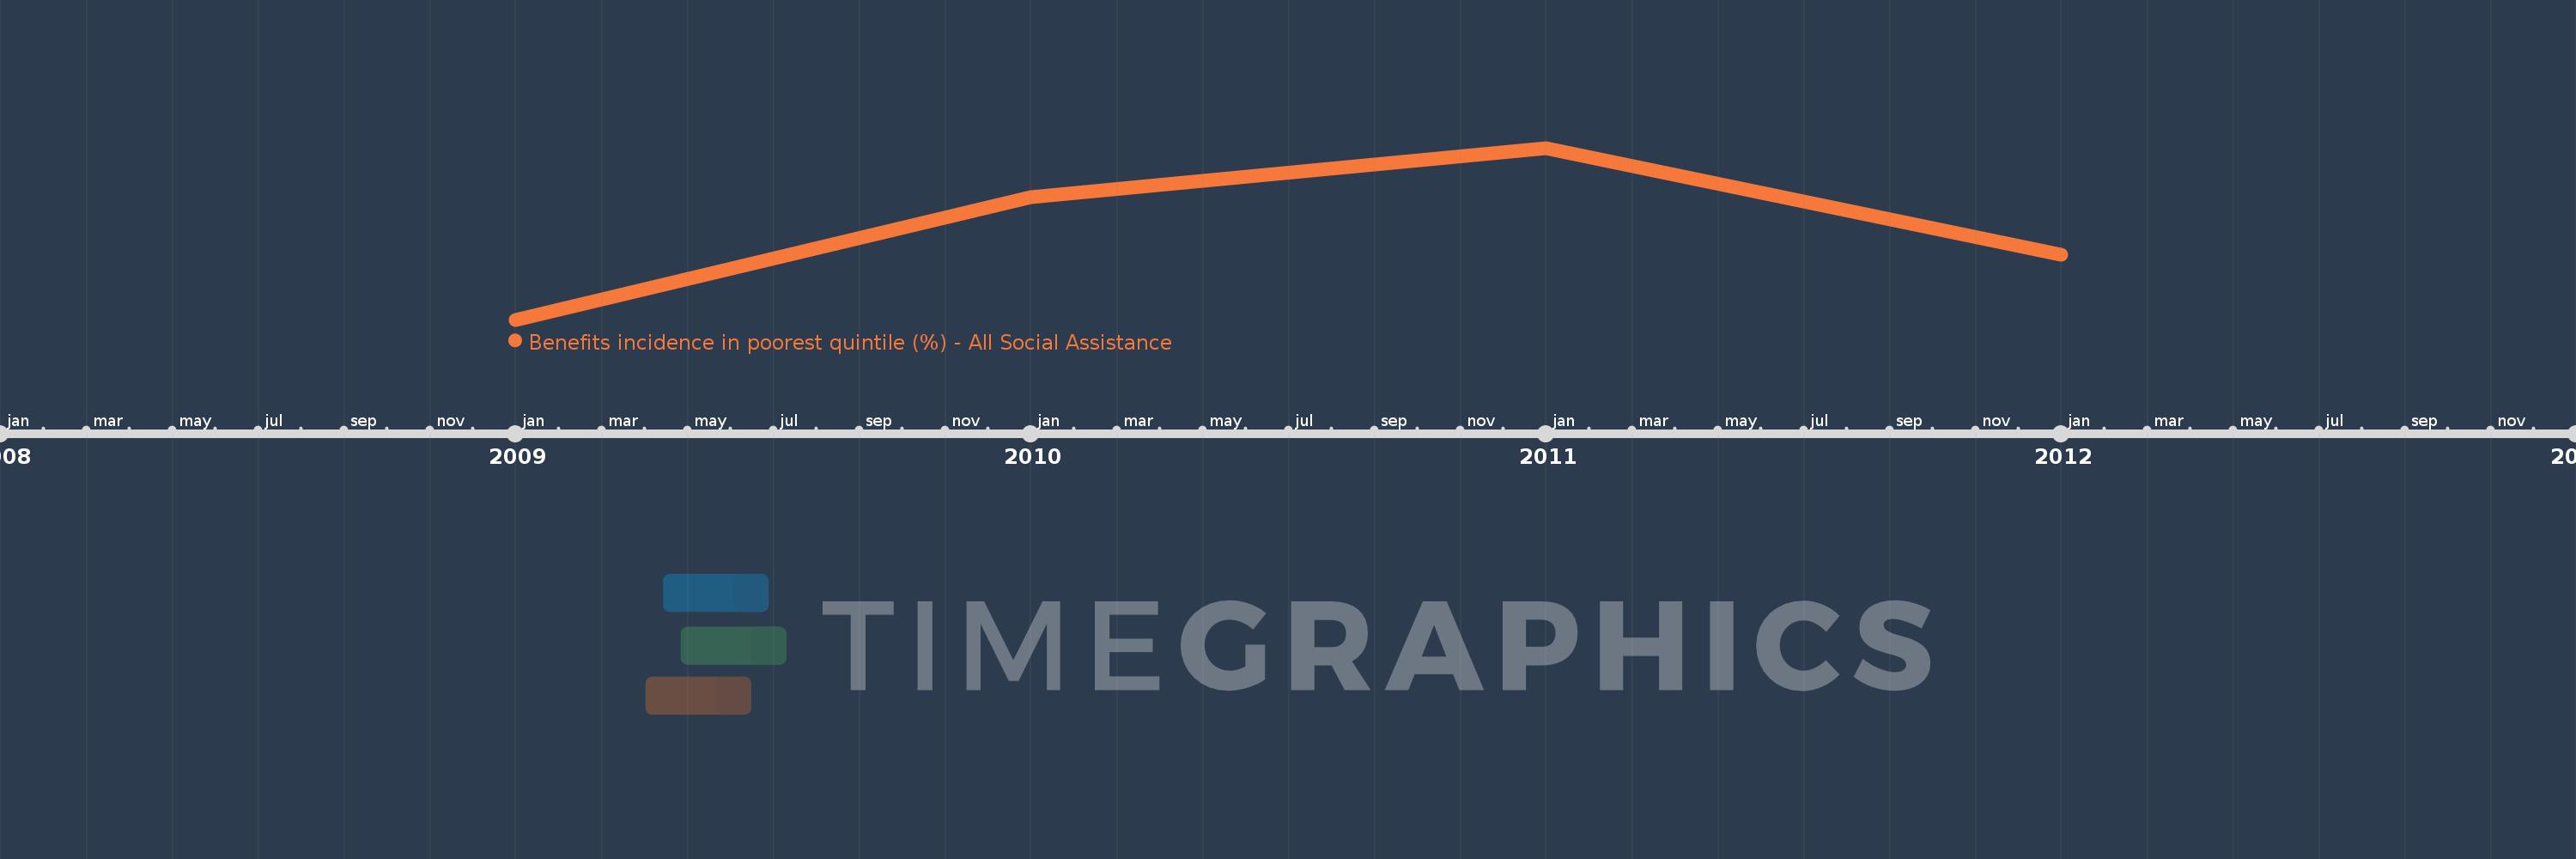
Benefits incidence in poorest quintile (%) - All Social Assistance
2012,2011,2010,2009
This statistics in other country:
Timeline:
This timeline shows a graph from 2009 to 2012 of Paraguay. No data until 2008. Number of actual observations by date: 4.
Source name:
World Development Indicators
Source organization:
The Atlas of Social Protection: Indicators of Resilience and Equity (ASPIRE)
Categories, topics:
Social Protection & Labor
Last updated:
apr 23, 2017
Indicators value changes by year
Maximum:
52.176
jan 1, 2011
At the date of observation
Value
Absolute change
Change from previous value
jan 1, 2009
8.702
+8.702
0.0%
jan 1, 2010
39.709
+31.007
356.32%
jan 1, 2011
52.176
+12.467
31.4%
jan 1, 2012
25.131
-27.045
-51.83%
Ranking of countries by current statistics by years


Comments: