29
/
en
AIzaSyAYiBZKx7MnpbEhh9jyipgxe19OcubqV5w
April 1, 2024
213726
Nigeria
NGA
true
2
1
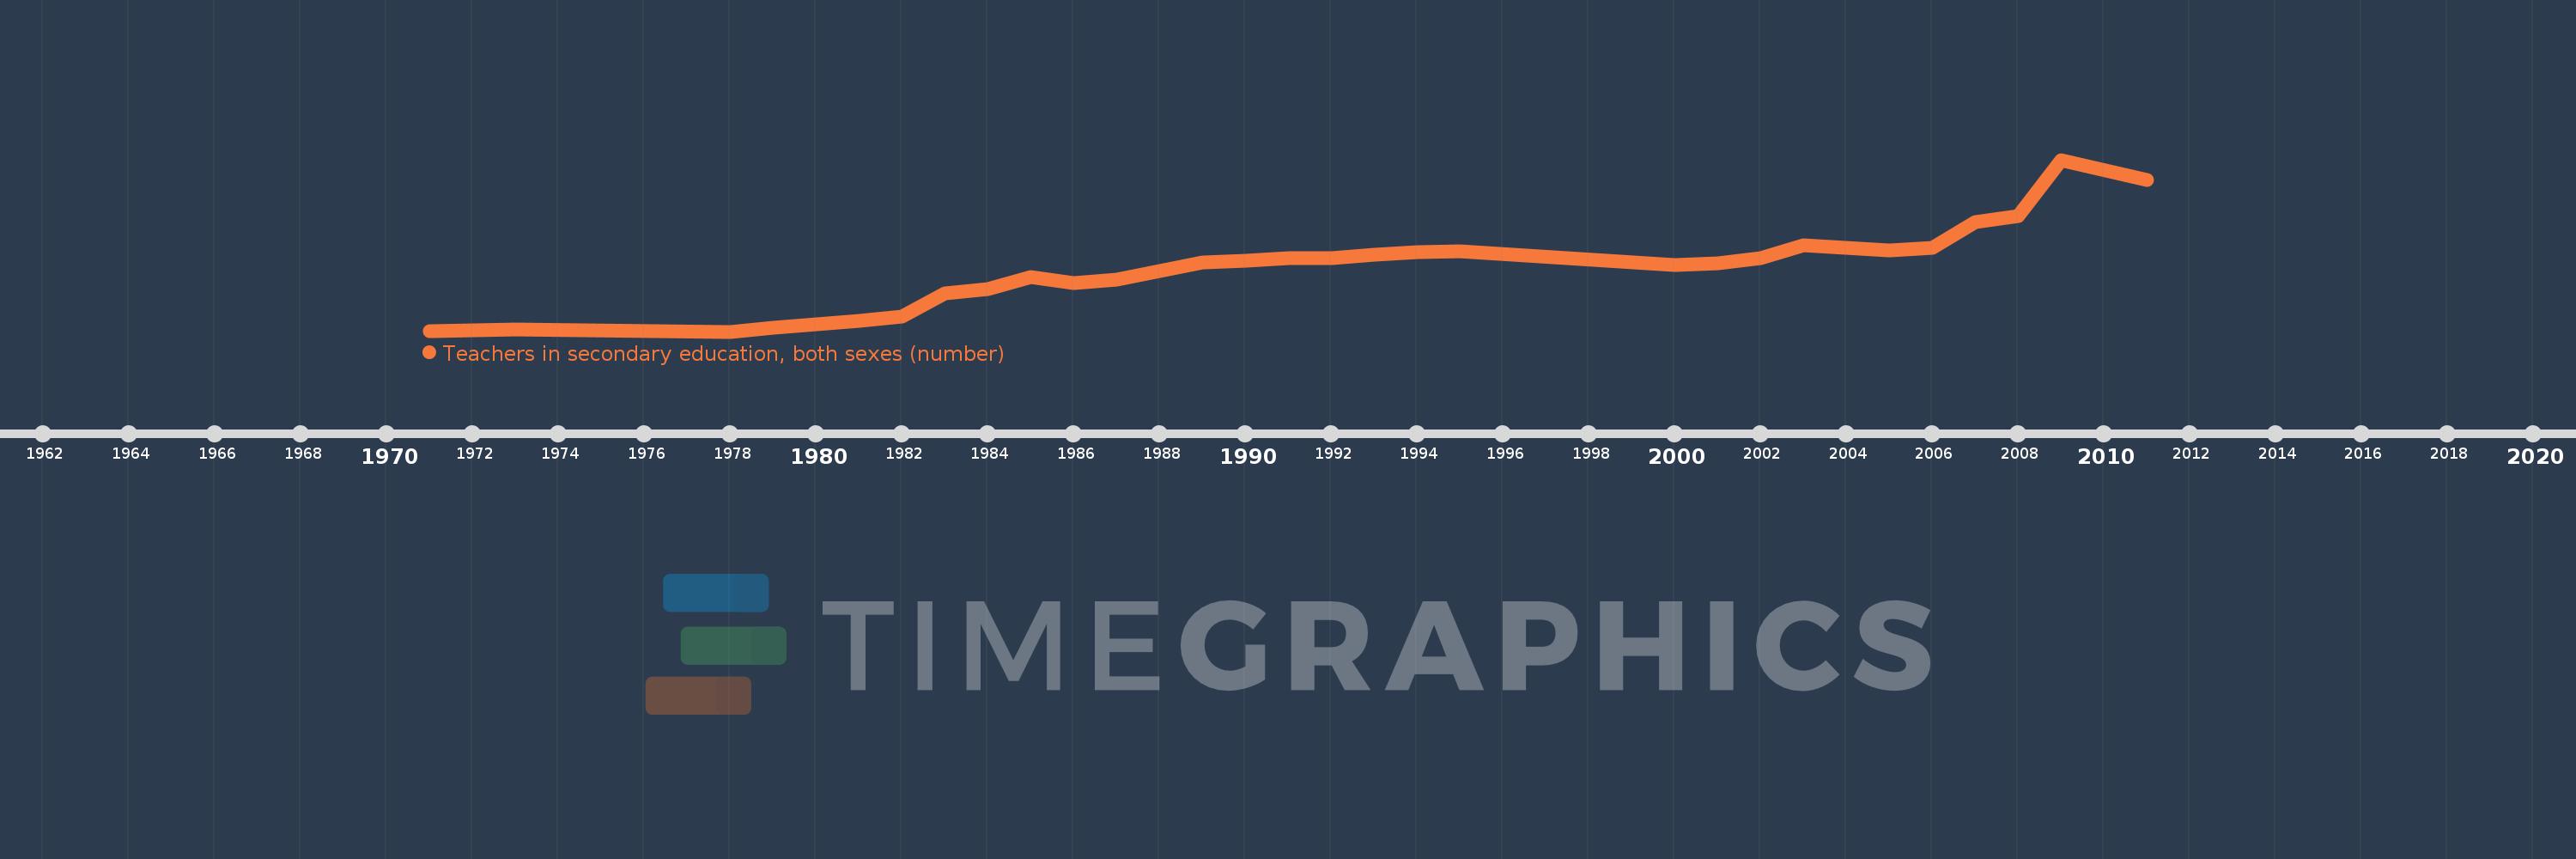
Teachers in secondary education, both sexes (number)
2011,2009,2008,2007,2006,2005,2003,2002,2001,2000,1995,1994,1993,1992,1991,1990,1989,1987,1986,1985,1984,1983,1982,1981,1980,1979,1978,1973,1971
This statistics in other country:
AfghanistanAlbaniaAlgeriaAmerican SamoaAndorraAngolaAntigua and BarbudaArab WorldArgentinaArmeniaArubaAustraliaAustriaBahamas, TheBahrainBangladeshBarbadosBelarusBelgiumBelizeBeninBermudaBhutanBoliviaBosnia and HerzegovinaBotswanaBrazilBritish Virgin IslandsBrunei DarussalamBulgariaBurkina FasoBurundiCabo VerdeCambodiaCameroonCanadaCaribbean small statesCayman IslandsCentral African RepublicCentral Europe and the BalticsChadChileChinaColombiaComorosCongo, Dem. Rep.Congo, Rep.Costa RicaCote d'IvoireCroatiaCubaCyprusCzech RepublicDenmarkDjiboutiDominicaDominican RepublicEarly-demographic dividendEast Asia & PacificEast Asia & Pacific (excluding high income)East Asia & Pacific (IDA & IBRD countries)EcuadorEgypt, Arab Rep.El SalvadorEquatorial GuineaEritreaEstoniaEthiopiaEuro areaEurope & Central AsiaEurope & Central Asia (excluding high income)Europe & Central Asia (IDA & IBRD countries)European UnionFijiFinlandFragile and conflict affected situationsFranceFrench PolynesiaGabonGambia, TheGeorgiaGermanyGhanaGibraltarGreeceGrenadaGuamGuatemalaGuineaGuinea-BissauGuyanaHaitiHeavily indebted poor countries (HIPC)High incomeHondurasHong Kong SAR, ChinaHungaryIBRD onlyIcelandIDA & IBRD totalIDA blendIDA onlyIDA totalIndiaIndonesiaIran, Islamic Rep.IraqIrelandIsraelItalyJamaicaJapanJordanKazakhstanKenyaKiribatiKorea, Dem. People’s Rep.Korea, Rep.KuwaitKyrgyz RepublicLao PDRLate-demographic dividendLatin America & Caribbean Latin America & Caribbean (excluding high income)Latin America & the Caribbean (IDA & IBRD countries)LatviaLeast developed countries: UN classificationLebanonLesothoLiberiaLibyaLiechtensteinLithuaniaLow & middle incomeLow incomeLower middle incomeLuxembourgMacao SAR, ChinaMacedonia, FYRMadagascarMalawiMalaysiaMaldivesMaliMaltaMarshall IslandsMauritaniaMauritiusMexicoMiddle East & North AfricaMiddle East & North Africa (excluding high income)Middle East & North Africa (IDA & IBRD countries)Middle incomeMoldovaMonacoMongoliaMoroccoMozambiqueMyanmarNamibiaNauruNepalNetherlandsNew CaledoniaNew ZealandNicaraguaNigerNigeriaNorth AmericaNorwayOECD membersOmanOther small statesPacific island small statesPakistanPalauPanamaPapua New GuineaParaguayPeruPhilippinesPolandPortugalPost-demographic dividendPre-demographic dividendPuerto RicoQatarRomaniaRussian FederationRwandaSamoaSan MarinoSao Tome and PrincipeSaudi ArabiaSenegalSerbiaSeychellesSierra LeoneSingaporeSint Maarten (Dutch part)Slovak RepublicSloveniaSmall statesSolomon IslandsSomaliaSouth AfricaSouth AsiaSouth Asia (IDA & IBRD)SpainSri LankaSt. Kitts and NevisSt. LuciaSt. Vincent and the GrenadinesSub-Saharan Africa Sub-Saharan Africa (excluding high income)Sub-Saharan Africa (IDA & IBRD countries)SudanSurinameSwazilandSwedenSwitzerlandSyrian Arab RepublicTajikistanTanzaniaThailandTimor-LesteTogoTongaTrinidad and TobagoTunisiaTurkeyTurks and Caicos IslandsUgandaUkraineUnited Arab EmiratesUnited KingdomUnited StatesUpper middle incomeUruguayUzbekistanVanuatuVenezuela, RBVietnamVirgin Islands (U.S.)West Bank and GazaWorldYemen, Rep.ZambiaZimbabwe Timeline:
This timeline shows a graph from 1971 to 2011 of Nigeria. No data until 1970. Number of actual observations by date: 29.
Source name:
World Development Indicators
Source organization:
UNESCO Institute for Statistics
Categories, topics:
Education
Last updated:
apr 23, 2017
Indicators value changes by year
Minimum:
16.686K
jan 1, 1978
Maximum:
308.311K
jan 1, 2009
At the date of observation
Value
Absolute change
Change from previous value
jan 1, 1971
16.794K
+16.794K
0.0%
jan 1, 1973
19.61K
+2.816K
16.77%
jan 1, 1978
16.686K
-2.924K
-14.91%
jan 1, 1979
23.946K
+7.26K
43.51%
jan 1, 1980
29.443K
+5.497K
22.96%
jan 1, 1981
34.629K
+5.186K
17.61%
jan 1, 1982
41.581K
+6.952K
20.08%
jan 1, 1983
81.492K
+39.911K
95.98%
jan 1, 1984
89.076K
+7.584K
9.31%
jan 1, 1985
108.664K
+19.588K
21.99%
jan 1, 1986
98.487K
-10.177K
-9.37%
jan 1, 1987
105.003K
+6.516K
6.62%
jan 1, 1989
134.4K
+29.397K
28.0%
jan 1, 1990
136.677K
+2.277K
1.69%
jan 1, 1991
141.377K
+4.7K
3.44%
jan 1, 1992
141.491K
+114.0
0.08%
jan 1, 1993
147.53K
+6.039K
4.27%
jan 1, 1994
151.722K
+4.192K
2.84%
jan 1, 1995
152.596K
+874.0
0.58%
jan 1, 2000
129.013K
-23.583K
-15.45%
jan 1, 2001
132.884K
+3.871K
3.0%
jan 1, 2002
140.631K
+7.747K
5.83%
jan 1, 2003
162.96K
+22.329K
15.88%
jan 1, 2005
154.594K
-8.366K
-5.13%
jan 1, 2006
159.283K
+4.689K
3.03%
jan 1, 2007
202.082K
+42.799K
26.87%
jan 1, 2008
213.366K
+11.284K
5.58%
jan 1, 2009
308.311K
+94.945K
44.5%
jan 1, 2011
273.781K
-34.53K
-11.2%
Ranking of countries by current statistics by years


Comments: