29
/
en
AIzaSyAYiBZKx7MnpbEhh9jyipgxe19OcubqV5w
April 1, 2024
213588
Nigeria
NGA
true
2
1
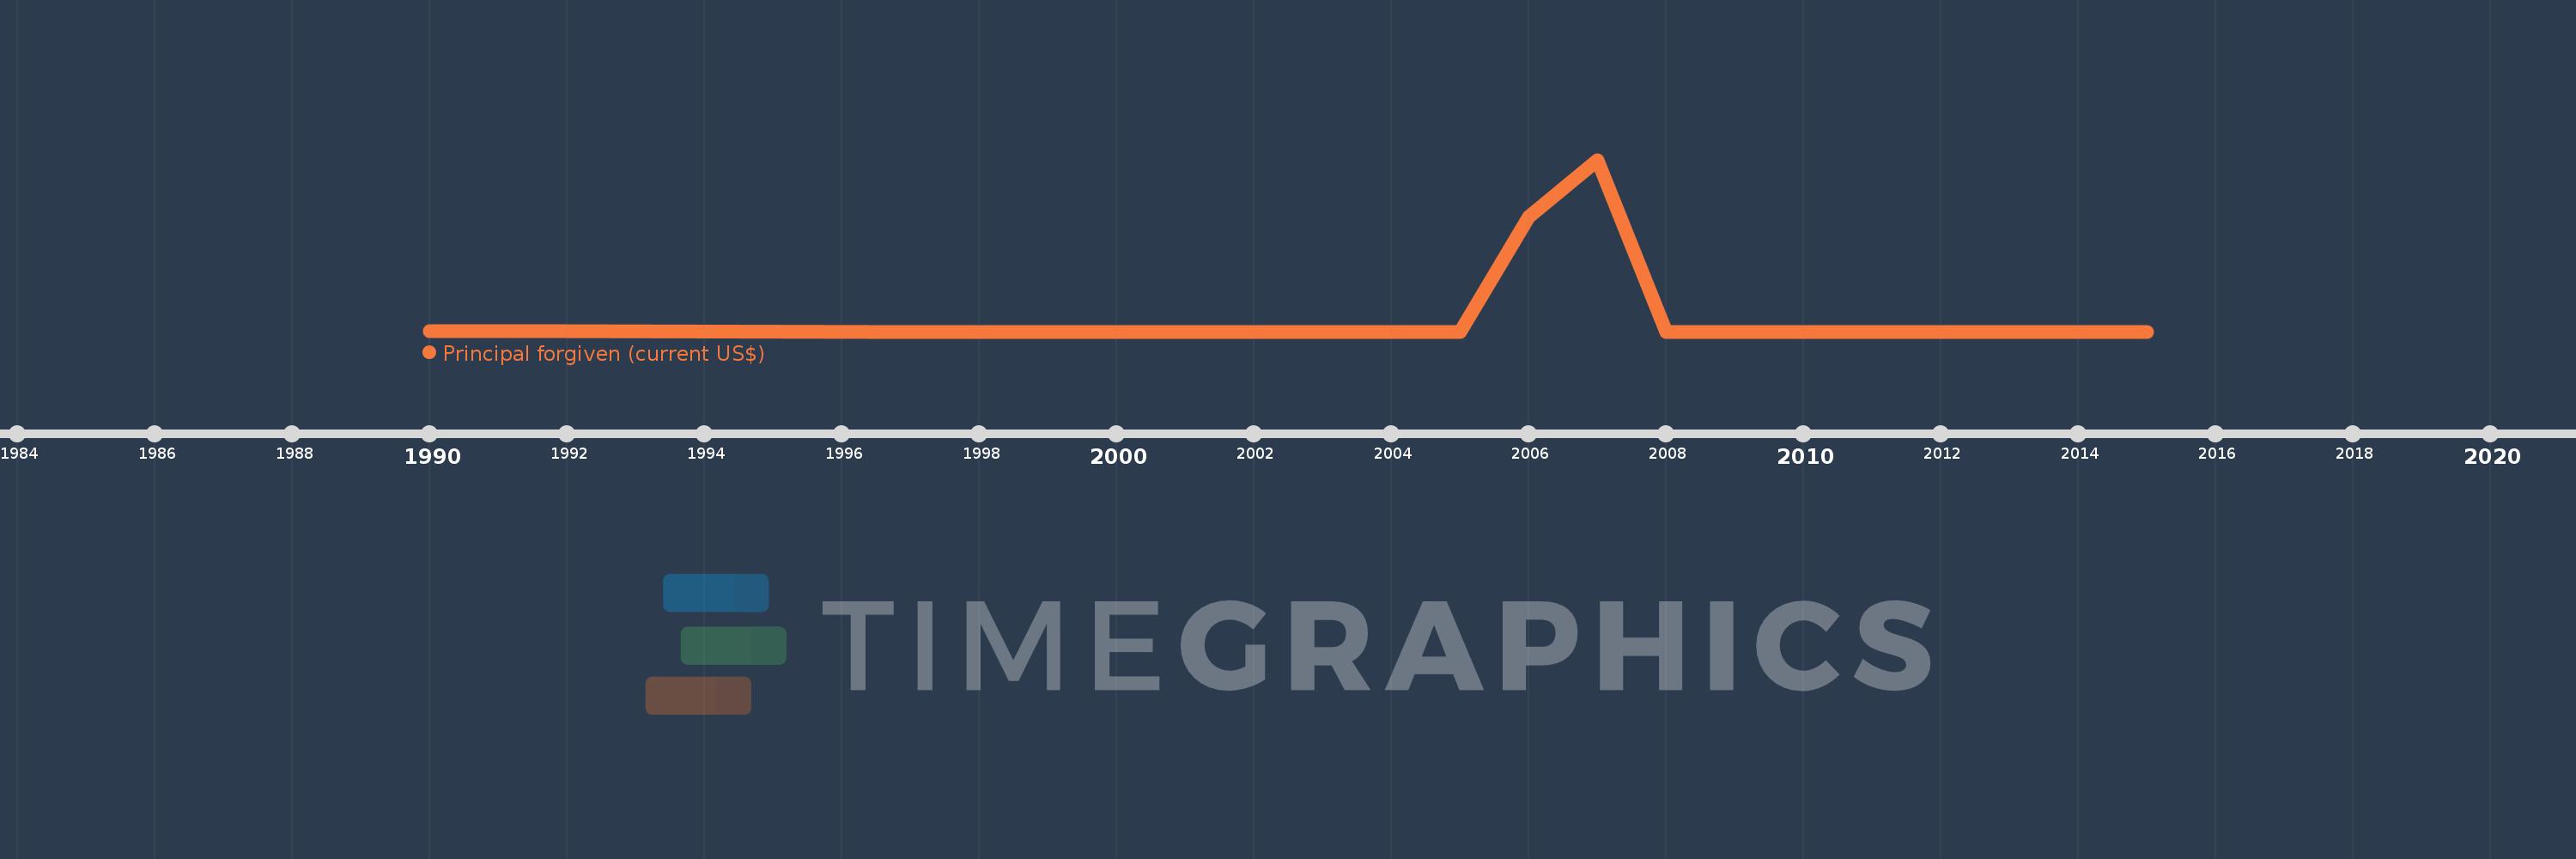
Principal forgiven (current US$)
2015,2014,2013,2012,2011,2010,2009,2008,2007,2006,2005,2004,2002,2000,1997,1992,1990
This statistics in other country:
Timeline:
This timeline shows a graph from 1990 to 2015 of Nigeria. No data until 1989. Number of actual observations by date: 17.
Source name:
World Development Indicators
Source organization:
World Bank, International Debt Statistics.
Categories, topics:
External Debt
Last updated:
apr 23, 2017
Indicators value changes by year
Maximum:
10.887 bln
jan 1, 2007
At the date of observation
Value
Absolute change
Change from previous value
jan 1, 1990
31.304 mln
+31.304 mln
0.0%
jan 1, 1992
14.123 mln
-17.181 mln
-54.88%
jan 1, 1997
0.0
-14.123 mln
-100.0%
jan 1, 2006
7.284 bln
+7.284 bln
%
jan 1, 2007
10.887 bln
+3.603 bln
49.47%
jan 1, 2008
0.0
-10.887 bln
-100.0%
Ranking of countries by current statistics by years


Comments: