29
/
en
AIzaSyAYiBZKx7MnpbEhh9jyipgxe19OcubqV5w
April 1, 2024
212284
Niger
NER
true
2
1
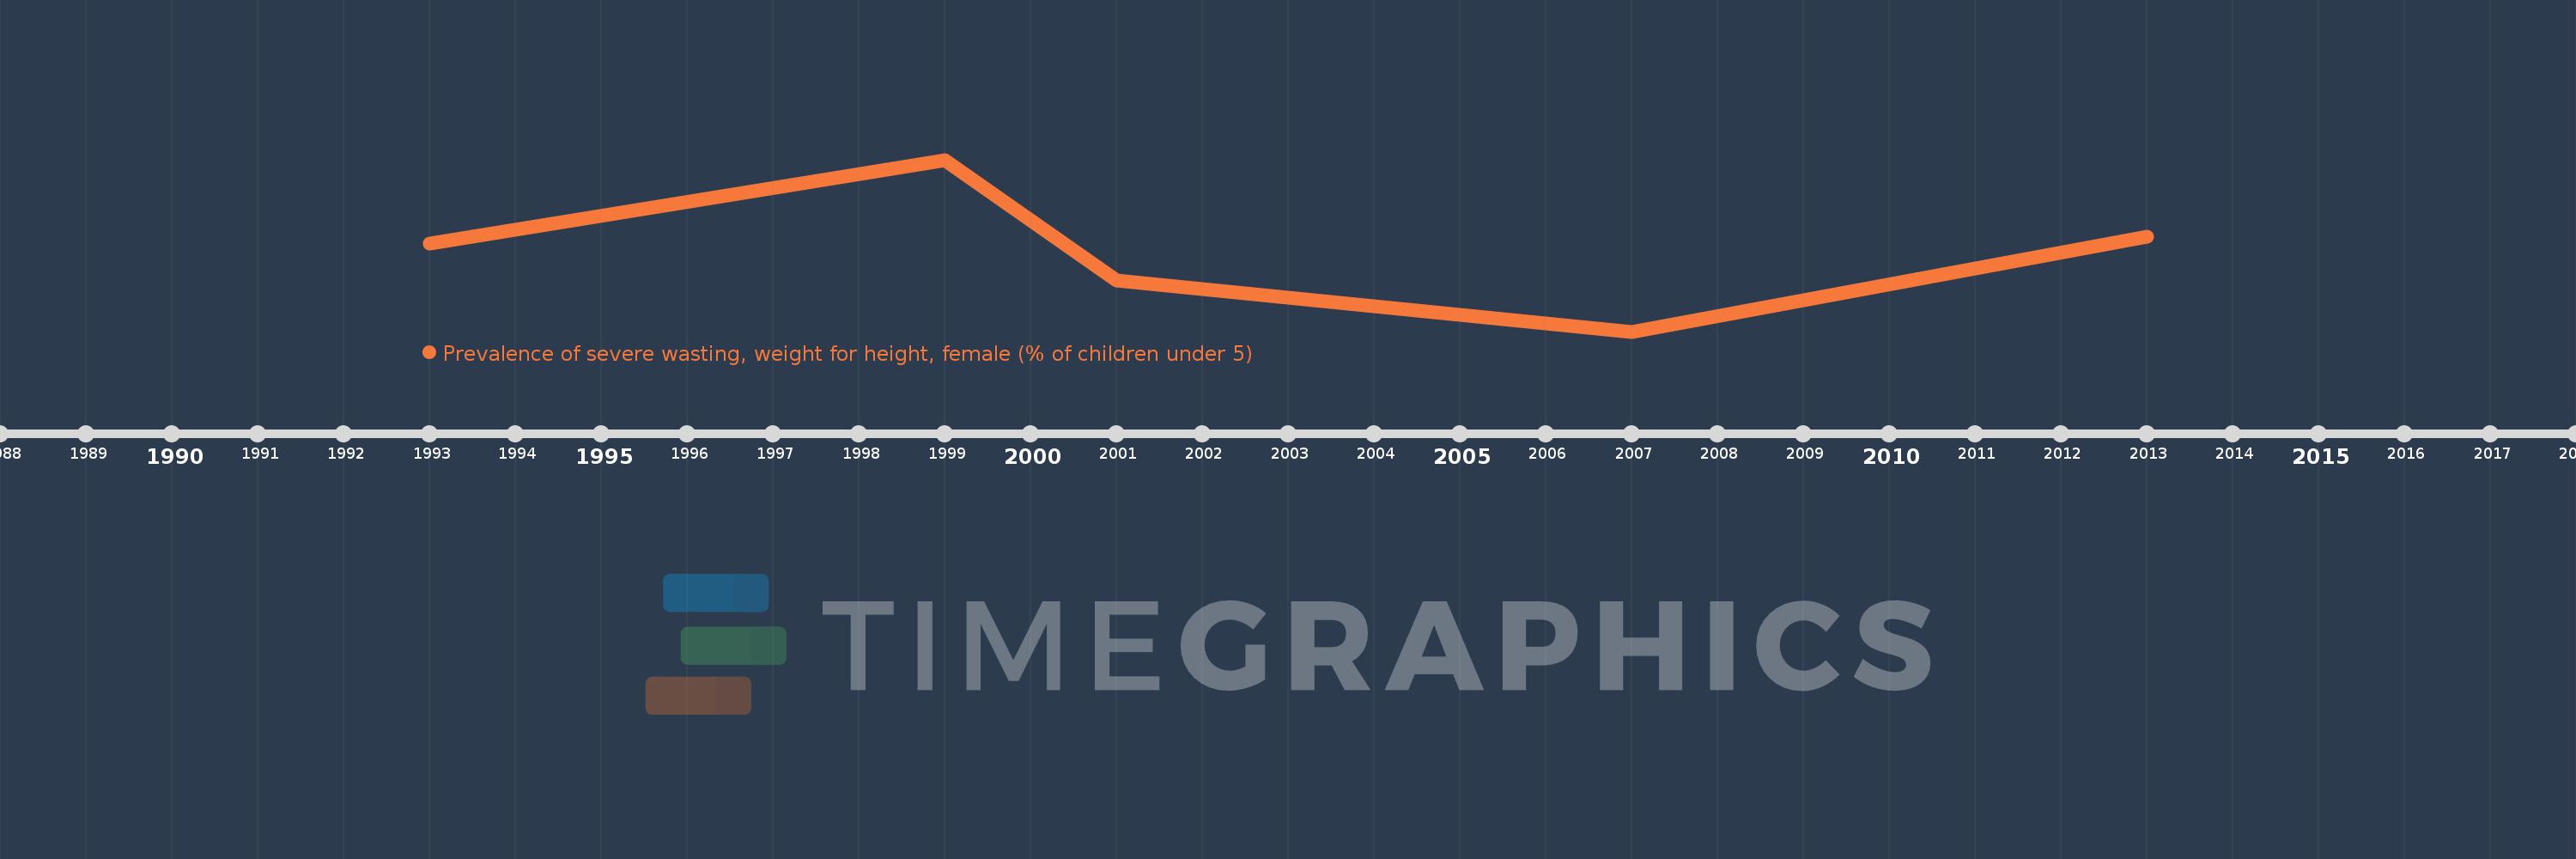
Prevalence of severe wasting, weight for height, female (% of children under 5)
2013,2007,2001,1999,1993
This statistics in other country:
Timeline:
This timeline shows a graph from 1993 to 2013 of Niger. No data until 1992. Number of actual observations by date: 5.
Source name:
World Development Indicators
Source organization:
World Health Organization, Global Database on Child Growth and Malnutrition. Country-level data are unadjusted data from national surveys, and thus may not be comparable across countries.
Categories, topics:
Health
Last updated:
apr 23, 2017
Indicators value changes by year
At the date of observation
Value
Absolute change
Change from previous value
jan 1, 1999
8.5
+2.3
37.1%
jan 1, 2001
5.2
-3.3
-38.82%
jan 1, 2007
3.8
-1.4
-26.92%
jan 1, 2013
6.4
+2.6
68.42%
Ranking of countries by current statistics by years


Comments: