29
/
en
AIzaSyAYiBZKx7MnpbEhh9jyipgxe19OcubqV5w
April 1, 2024
212226
Niger
NER
true
2
1
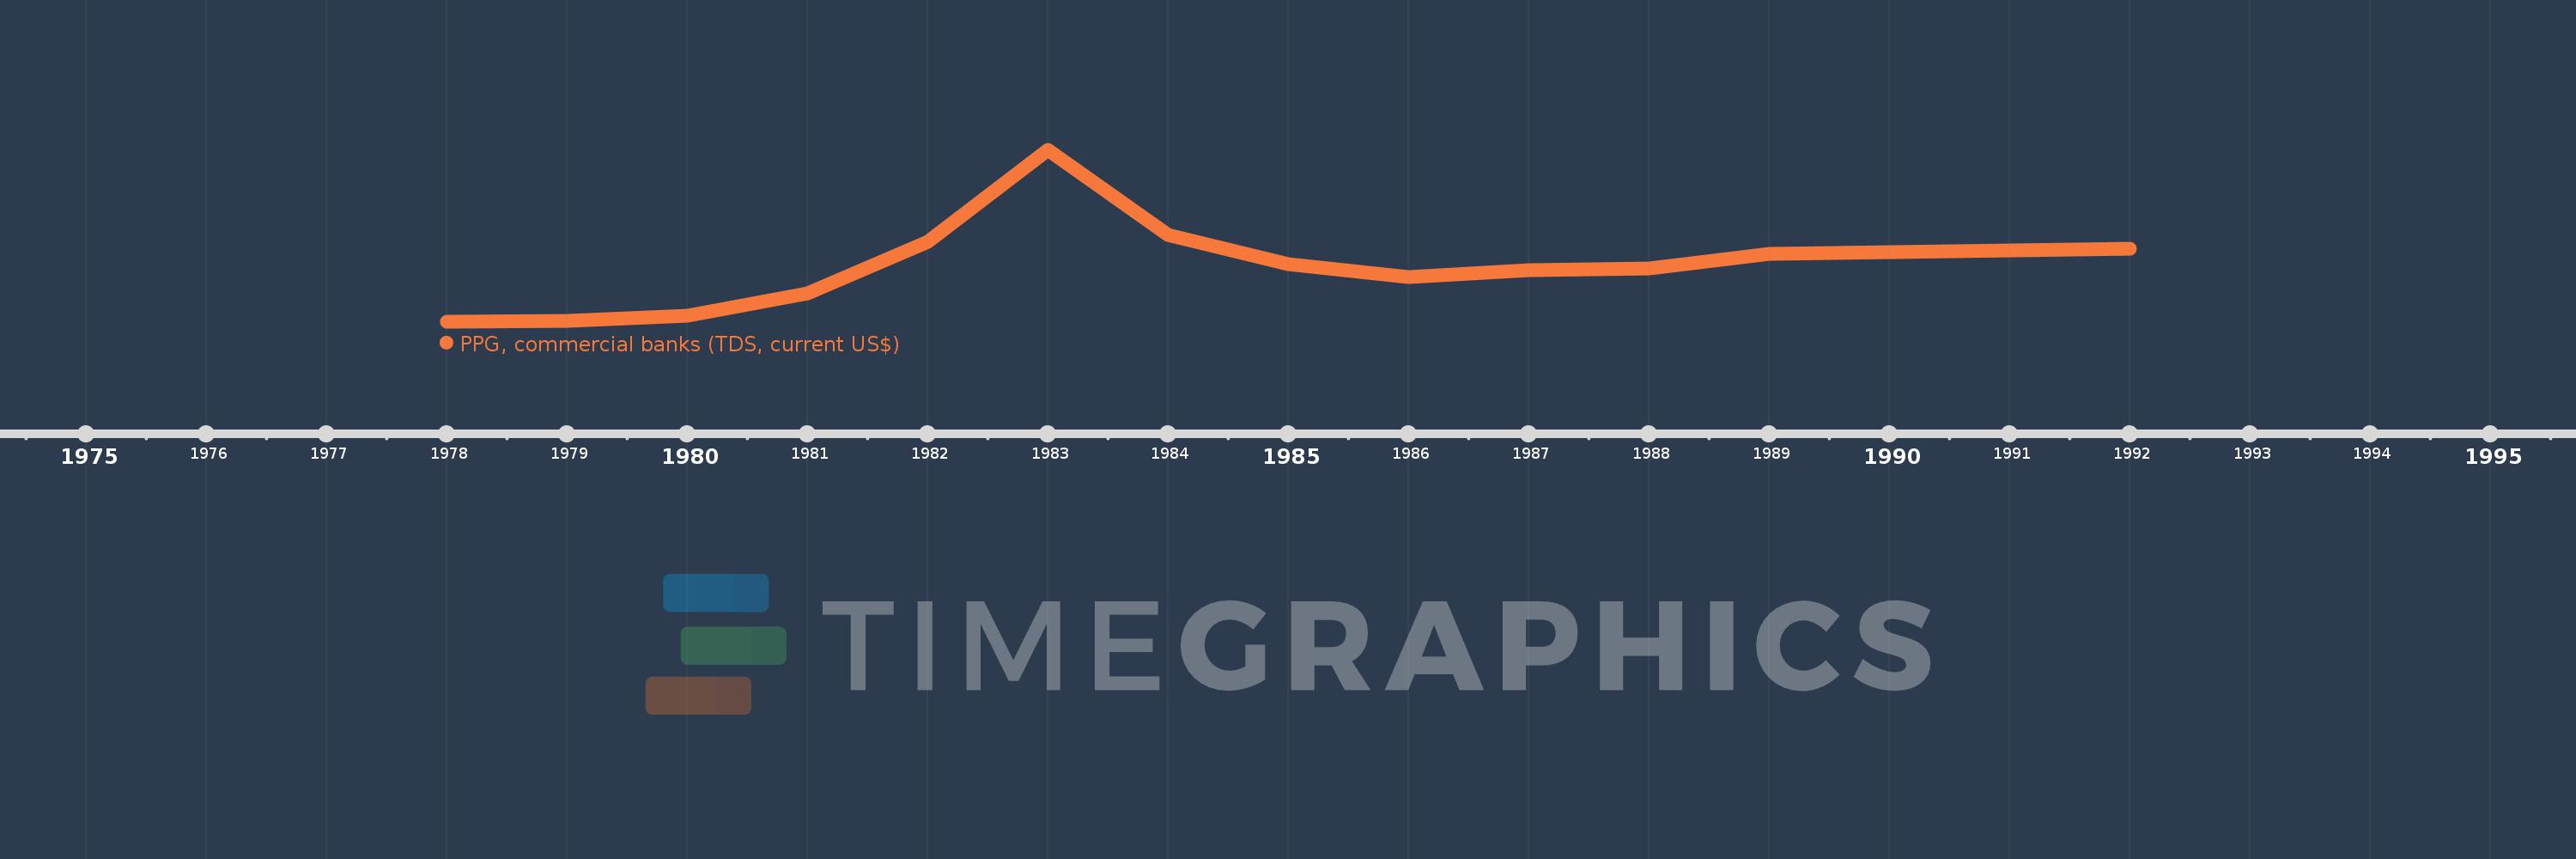
PPG, commercial banks (TDS, current US$)
1992,1989,1988,1987,1986,1985,1984,1983,1982,1981,1980,1979,1978
This statistics in other country:
Timeline:
This timeline shows a graph from 1978 to 1992 of Niger. No data until 1977. Number of actual observations by date: 13.
Source name:
World Development Indicators
Source organization:
World Bank, International Debt Statistics.
Categories, topics:
External Debt
Last updated:
apr 23, 2017
Indicators value changes by year
Minimum:
259.0K
jan 1, 1978
Maximum:
43.178 mln
jan 1, 1983
At the date of observation
Value
Absolute change
Change from previous value
jan 1, 1978
259.0K
+259.0K
0.0%
jan 1, 1979
619.0K
+360.0K
139.0%
jan 1, 1980
1.794 mln
+1.175 mln
189.82%
jan 1, 1981
7.339 mln
+5.545 mln
309.09%
jan 1, 1982
20.344 mln
+13.005 mln
177.2%
jan 1, 1983
43.178 mln
+22.834 mln
112.24%
jan 1, 1984
22.097 mln
-21.081 mln
-48.82%
jan 1, 1985
14.745 mln
-7.352 mln
-33.27%
jan 1, 1986
11.4 mln
-3.345 mln
-22.69%
jan 1, 1987
13.154 mln
+1.754 mln
15.39%
jan 1, 1988
13.589 mln
+435.0K
3.31%
jan 1, 1989
17.329 mln
+3.74 mln
27.52%
jan 1, 1992
18.499 mln
+1.17 mln
6.75%
Ranking of countries by current statistics by years


Comments: