29
/
en
AIzaSyAYiBZKx7MnpbEhh9jyipgxe19OcubqV5w
April 1, 2024
211033
Nicaragua
NIC
true
2
1
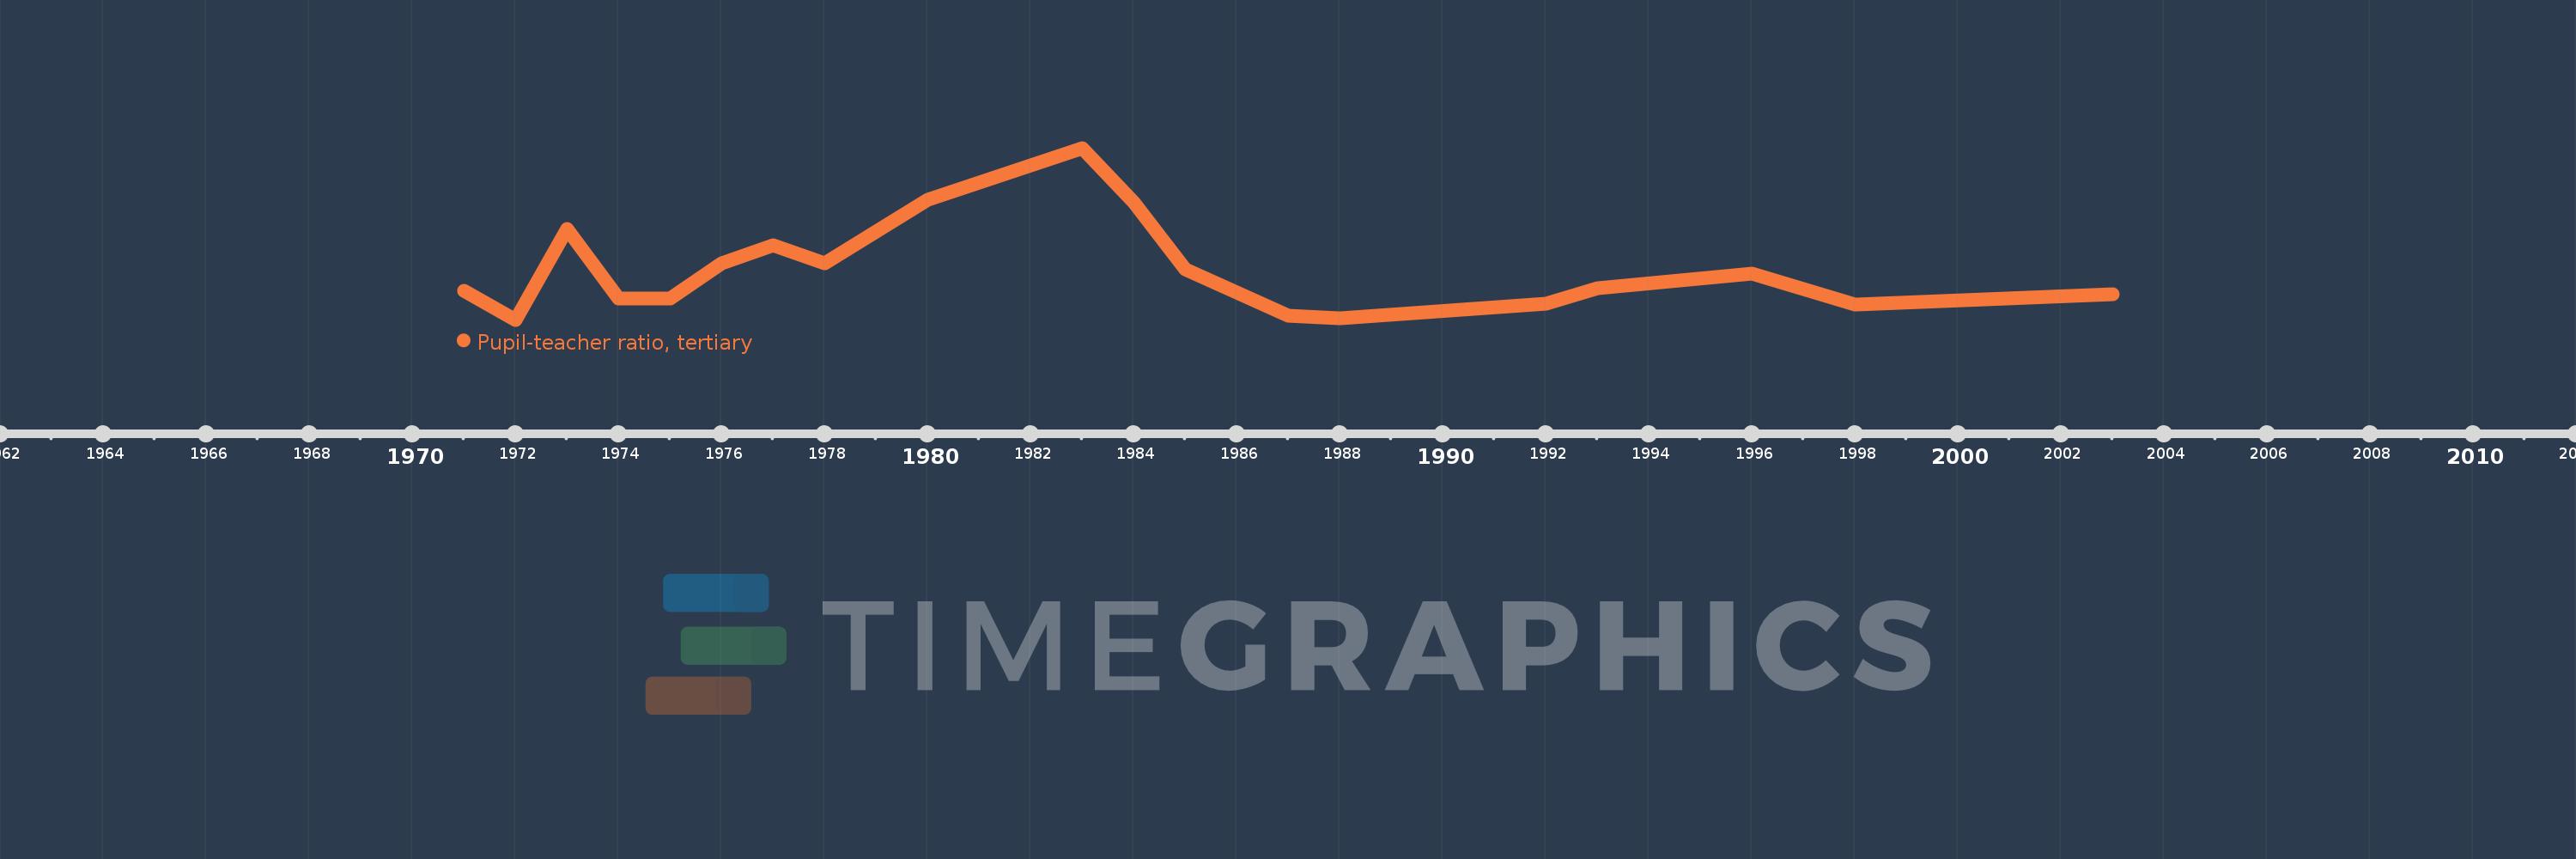
Pupil-teacher ratio, tertiary
2003,1998,1996,1993,1992,1988,1987,1985,1984,1983,1980,1978,1977,1976,1975,1974,1973,1972,1971
This statistics in other country:
AfghanistanAlbaniaAlgeriaAndorraAngolaAntigua and BarbudaArgentinaArmeniaArubaAustraliaAustriaAzerbaijanBahamas, TheBahrainBangladeshBarbadosBelarusBelgiumBelizeBeninBermudaBhutanBoliviaBosnia and HerzegovinaBotswanaBrazilBritish Virgin IslandsBrunei DarussalamBulgariaBurkina FasoBurundiCabo VerdeCambodiaCameroonCanadaCayman IslandsCentral African RepublicChadChileChinaColombiaComorosCongo, Dem. Rep.Congo, Rep.Costa RicaCote d'IvoireCroatiaCubaCyprusCzech RepublicDenmarkDjiboutiDominicaDominican RepublicEcuadorEgypt, Arab Rep.El SalvadorEquatorial GuineaEritreaEstoniaEthiopiaFijiFinlandFranceGabonGambia, TheGeorgiaGermanyGhanaGreeceGrenadaGuatemalaGuineaGuinea-BissauGuyanaHaitiHondurasHong Kong SAR, ChinaHungaryIcelandIndiaIndonesiaIran, Islamic Rep.IraqIrelandIsraelItalyJamaicaJapanJordanKazakhstanKorea, Dem. People’s Rep.Korea, Rep.KuwaitKyrgyz RepublicLao PDRLatviaLebanonLesothoLiberiaLibyaLiechtensteinLithuaniaLuxembourgMacao SAR, ChinaMacedonia, FYRMadagascarMalawiMalaysiaMaldivesMaliMaltaMarshall IslandsMauritaniaMauritiusMexicoMicronesia, Fed. Sts.MoldovaMongoliaMoroccoMozambiqueMyanmarNamibiaNepalNetherlandsNew ZealandNicaraguaNigerNigeriaNorwayOmanPakistanPalauPanamaPapua New GuineaParaguayPeruPhilippinesPolandPortugalPuerto RicoQatarRomaniaRussian FederationRwandaSamoaSao Tome and PrincipeSaudi ArabiaSenegalSerbiaSeychellesSierra LeoneSingaporeSint Maarten (Dutch part)Slovak RepublicSloveniaSomaliaSouth AfricaSpainSri LankaSt. Kitts and NevisSt. LuciaSt. Vincent and the GrenadinesSudanSurinameSwazilandSwedenSwitzerlandSyrian Arab RepublicTajikistanTanzaniaThailandTimor-LesteTogoTongaTrinidad and TobagoTunisiaTurkeyTurkmenistanUgandaUkraineUnited Arab EmiratesUnited KingdomUnited StatesUruguayUzbekistanVanuatuVenezuela, RBVietnamWest Bank and GazaYemen, Rep.ZambiaZimbabwe Timeline:
This timeline shows a graph from 1971 to 2003 of Nicaragua. No data until 1970. Number of actual observations by date: 19.
Source name:
World Development Indicators
Source organization:
United Nations Educational, Scientific, and Cultural Organization (UNESCO) Institute for Statistics.
Categories, topics:
Education
Last updated:
apr 23, 2017
Indicators value changes by year
Minimum:
13.836
jan 1, 1972
Maximum:
23.987
jan 1, 1983
At the date of observation
Value
Absolute change
Change from previous value
jan 1, 1971
15.538
+15.538
0.0%
jan 1, 1972
13.836
-1.702
-10.95%
jan 1, 1973
19.201
+5.365
38.77%
jan 1, 1974
15.106
-4.095
-21.33%
jan 1, 1975
15.104
-0.002
-0.01%
jan 1, 1976
17.15
+2.046
13.55%
jan 1, 1977
18.244
+1.094
6.38%
jan 1, 1978
17.192
-1.052
-5.77%
jan 1, 1980
20.923
+3.731
21.7%
jan 1, 1983
23.987
+3.064
14.64%
jan 1, 1984
20.751
-3.236
-13.49%
jan 1, 1985
16.812
-3.939
-18.98%
jan 1, 1987
14.07
-2.743
-16.31%
jan 1, 1988
13.926
-0.143
-1.02%
jan 1, 1992
14.788
+0.862
6.19%
jan 1, 1993
15.712
+0.924
6.25%
jan 1, 1996
16.58
+0.868
5.52%
jan 1, 1998
14.729
-1.852
-11.17%
jan 1, 2003
15.33
+0.601
4.08%
Ranking of countries by current statistics by years


Comments: