29
/
en
AIzaSyAYiBZKx7MnpbEhh9jyipgxe19OcubqV5w
April 1, 2024
210528
Nicaragua
NIC
true
2
1
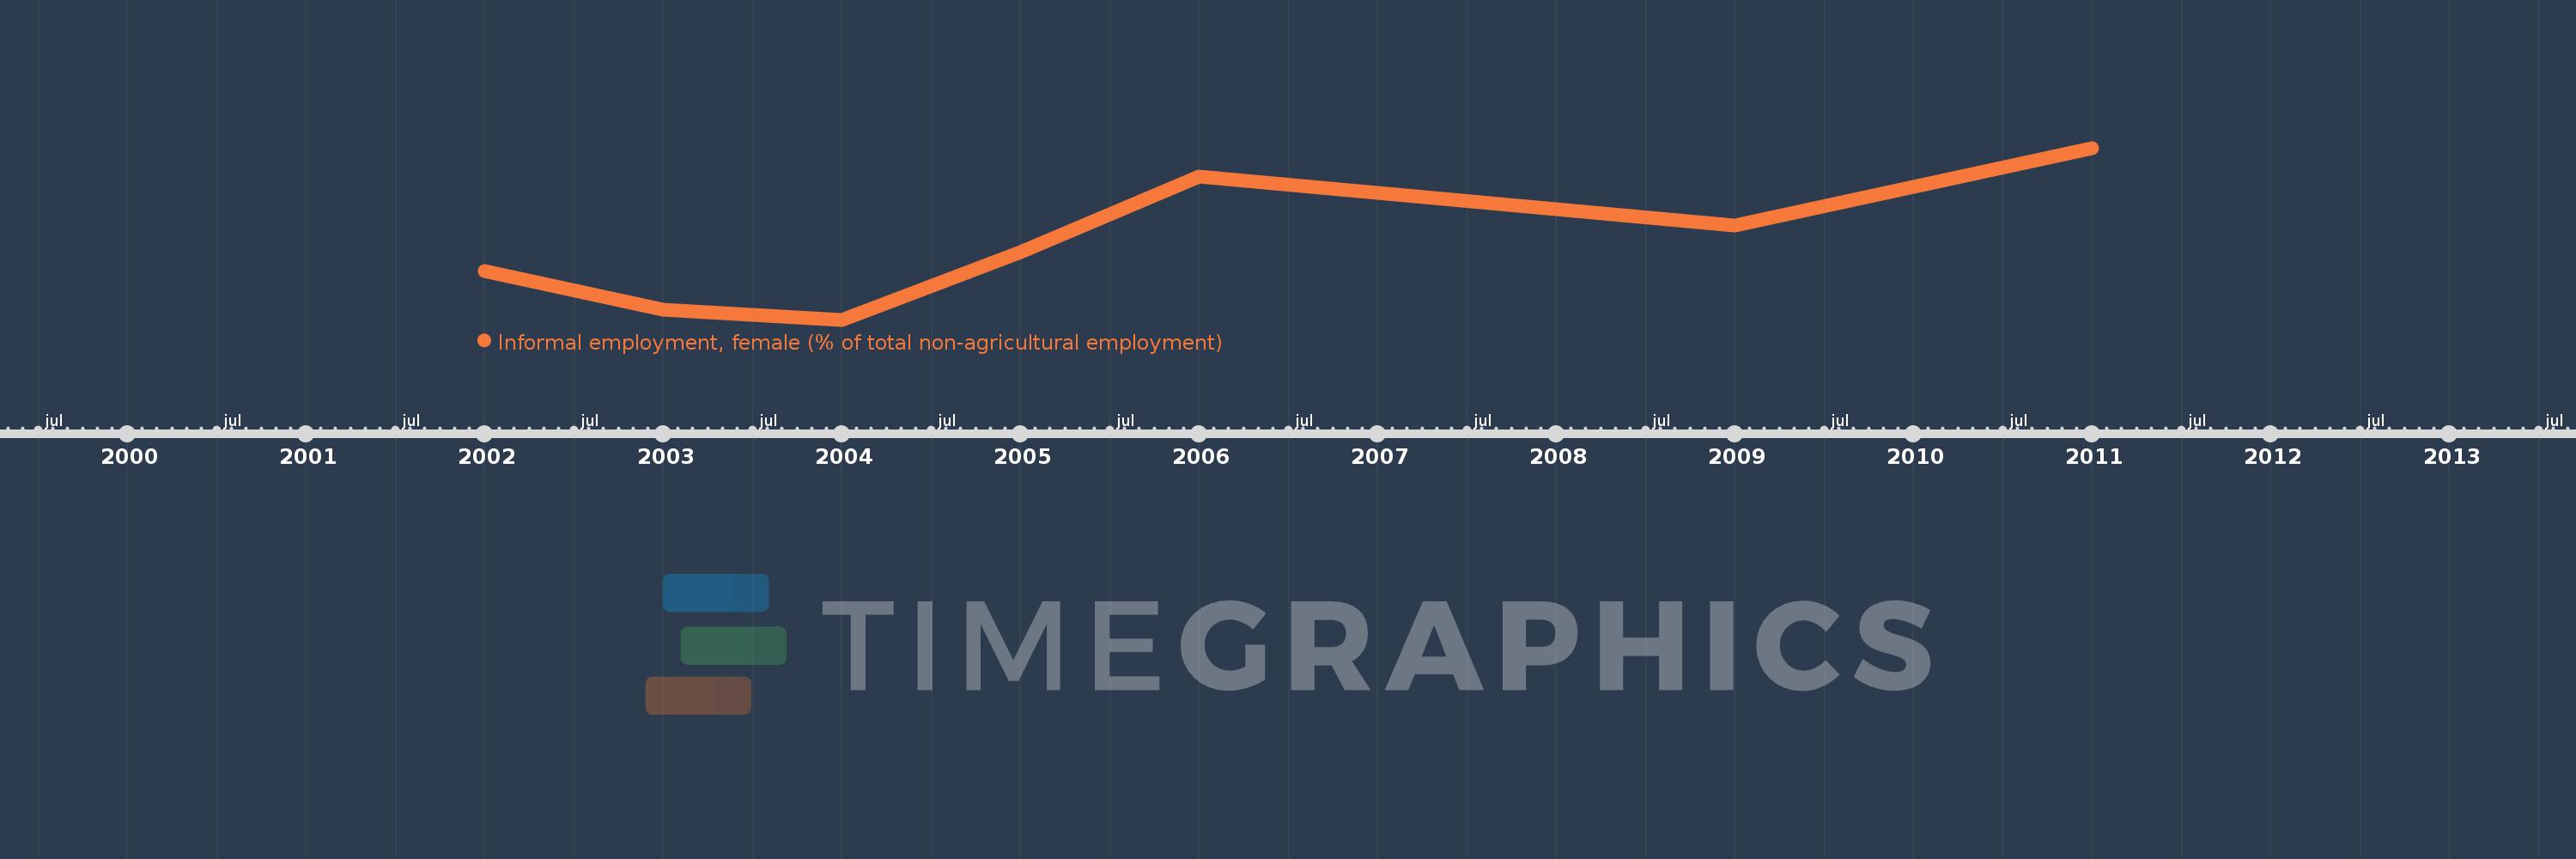
Informal employment, female (% of total non-agricultural employment)
2011,2009,2006,2005,2004,2003,2002
This statistics in other country:
Timeline:
This timeline shows a graph from 2002 to 2011 of Nicaragua. No data until 2001. Number of actual observations by date: 7.
Source name:
World Development Indicators
Source organization:
International Labour Organization, Key Indicators of the Labour Market database.
Categories, topics:
Social Protection & Labor
Last updated:
apr 23, 2017
Indicators value changes by year
At the date of observation
Value
Absolute change
Change from previous value
jan 1, 2002
60.2
+60.2
0.0%
jan 1, 2003
54.6
-5.6
-9.3%
jan 1, 2004
53.2
-1.4
-2.56%
jan 1, 2005
62.8
+9.6
18.05%
jan 1, 2006
73.6
+10.8
17.2%
jan 1, 2009
66.6
-7.0
-9.51%
jan 1, 2011
77.7
+11.1
16.67%
Ranking of countries by current statistics by years


Comments: