29
/
en
AIzaSyAYiBZKx7MnpbEhh9jyipgxe19OcubqV5w
April 1, 2024
207219
Nepal
NPL
true
2
1
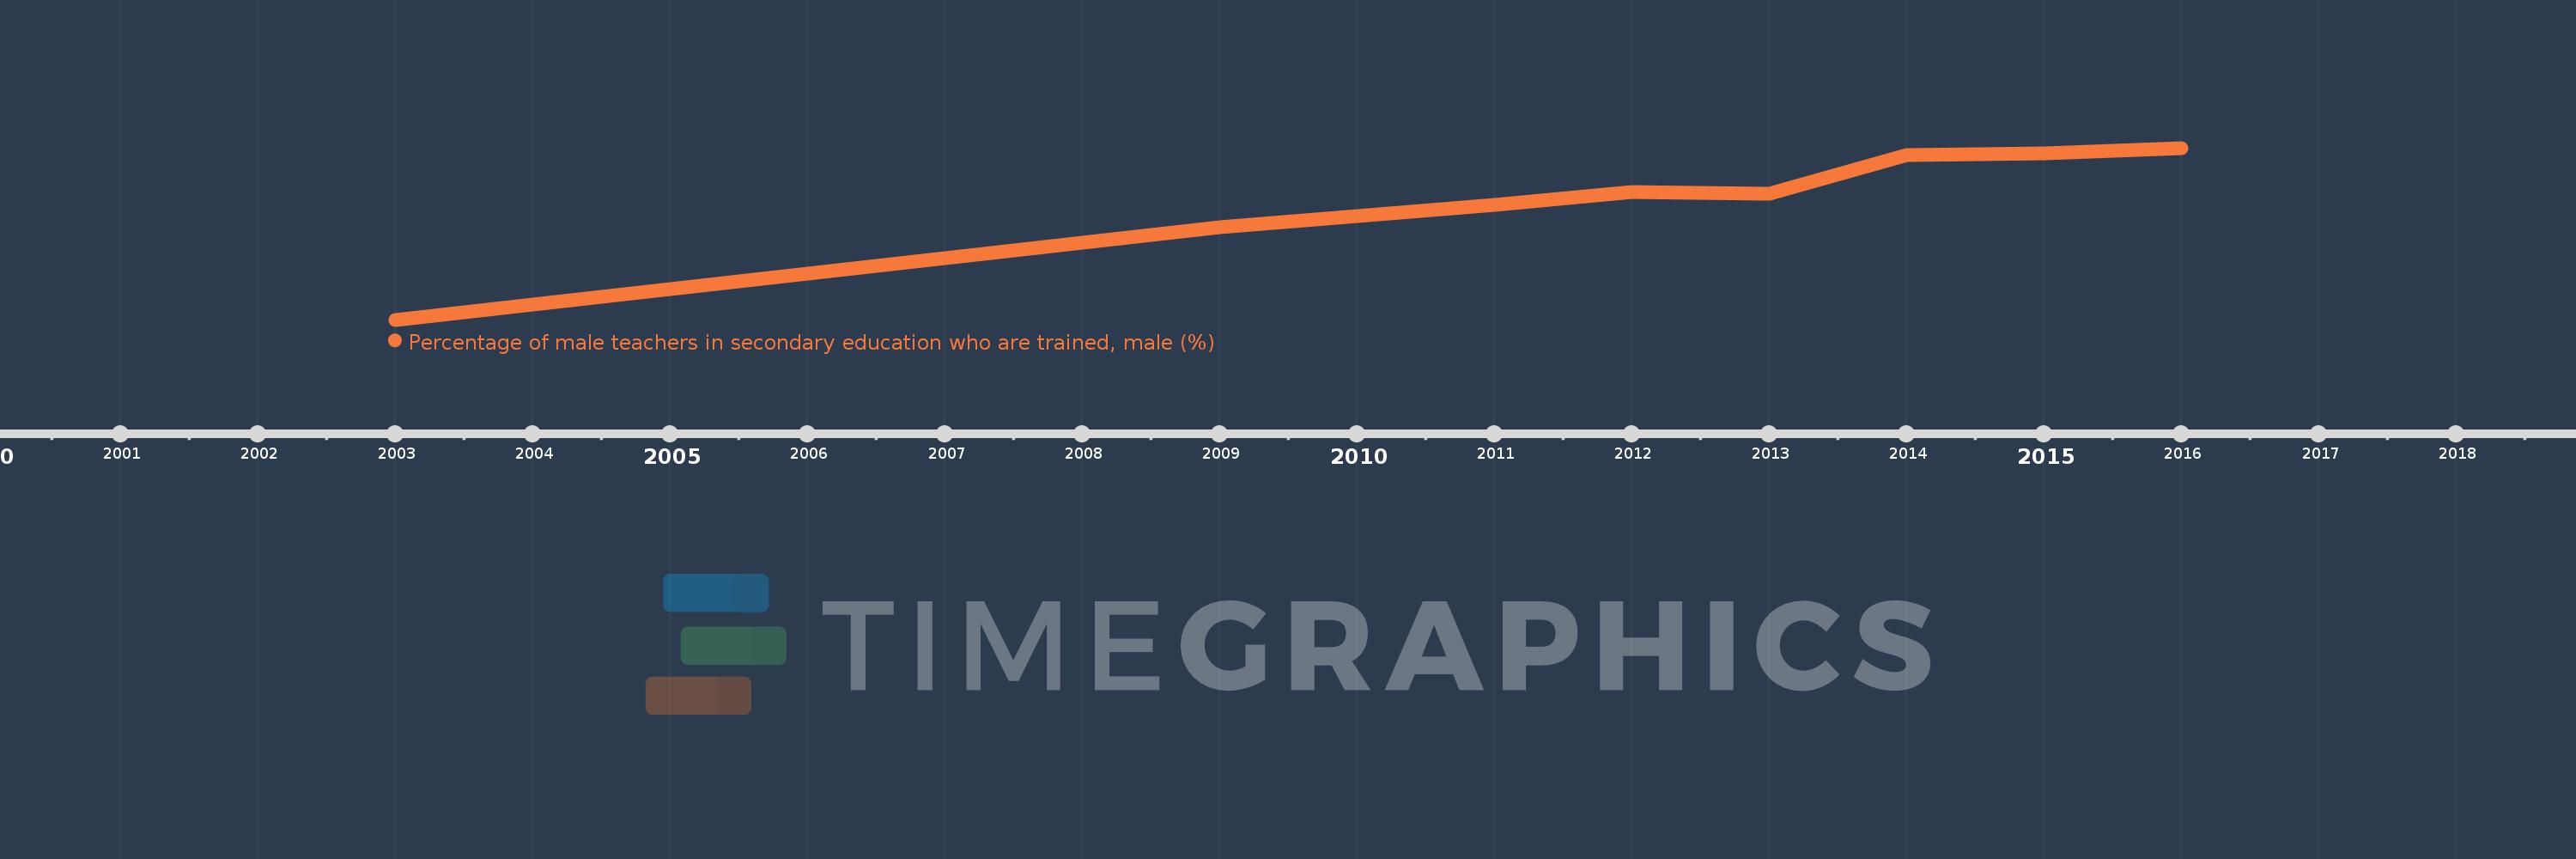
Percentage of male teachers in secondary education who are trained, male (%)
2016,2015,2014,2013,2012,2011,2009,2003
This statistics in other country:
Timeline:
This timeline shows a graph from 2003 to 2016 of Nepal. No data until 2002. Number of actual observations by date: 8.
Source name:
World Development Indicators
Source organization:
UNESCO Institute for Statistics
Categories, topics:
Education
Last updated:
apr 23, 2017
Indicators value changes by year
Minimum:
29.402
jan 1, 2003
Maximum:
82.315
jan 1, 2016
At the date of observation
Value
Absolute change
Change from previous value
jan 1, 2003
29.402
+29.402
0.0%
jan 1, 2009
57.908
+28.506
96.95%
jan 1, 2011
64.742
+6.834
11.8%
jan 1, 2012
68.839
+4.097
6.33%
jan 1, 2013
68.114
-0.726
-1.05%
jan 1, 2014
80.089
+11.976
17.58%
jan 1, 2015
80.516
+0.426
0.53%
jan 1, 2016
82.315
+1.799
2.23%
Ranking of countries by current statistics by years


Comments: