29
/
en
AIzaSyAYiBZKx7MnpbEhh9jyipgxe19OcubqV5w
April 1, 2024
206416
Nepal
NPL
true
2
1
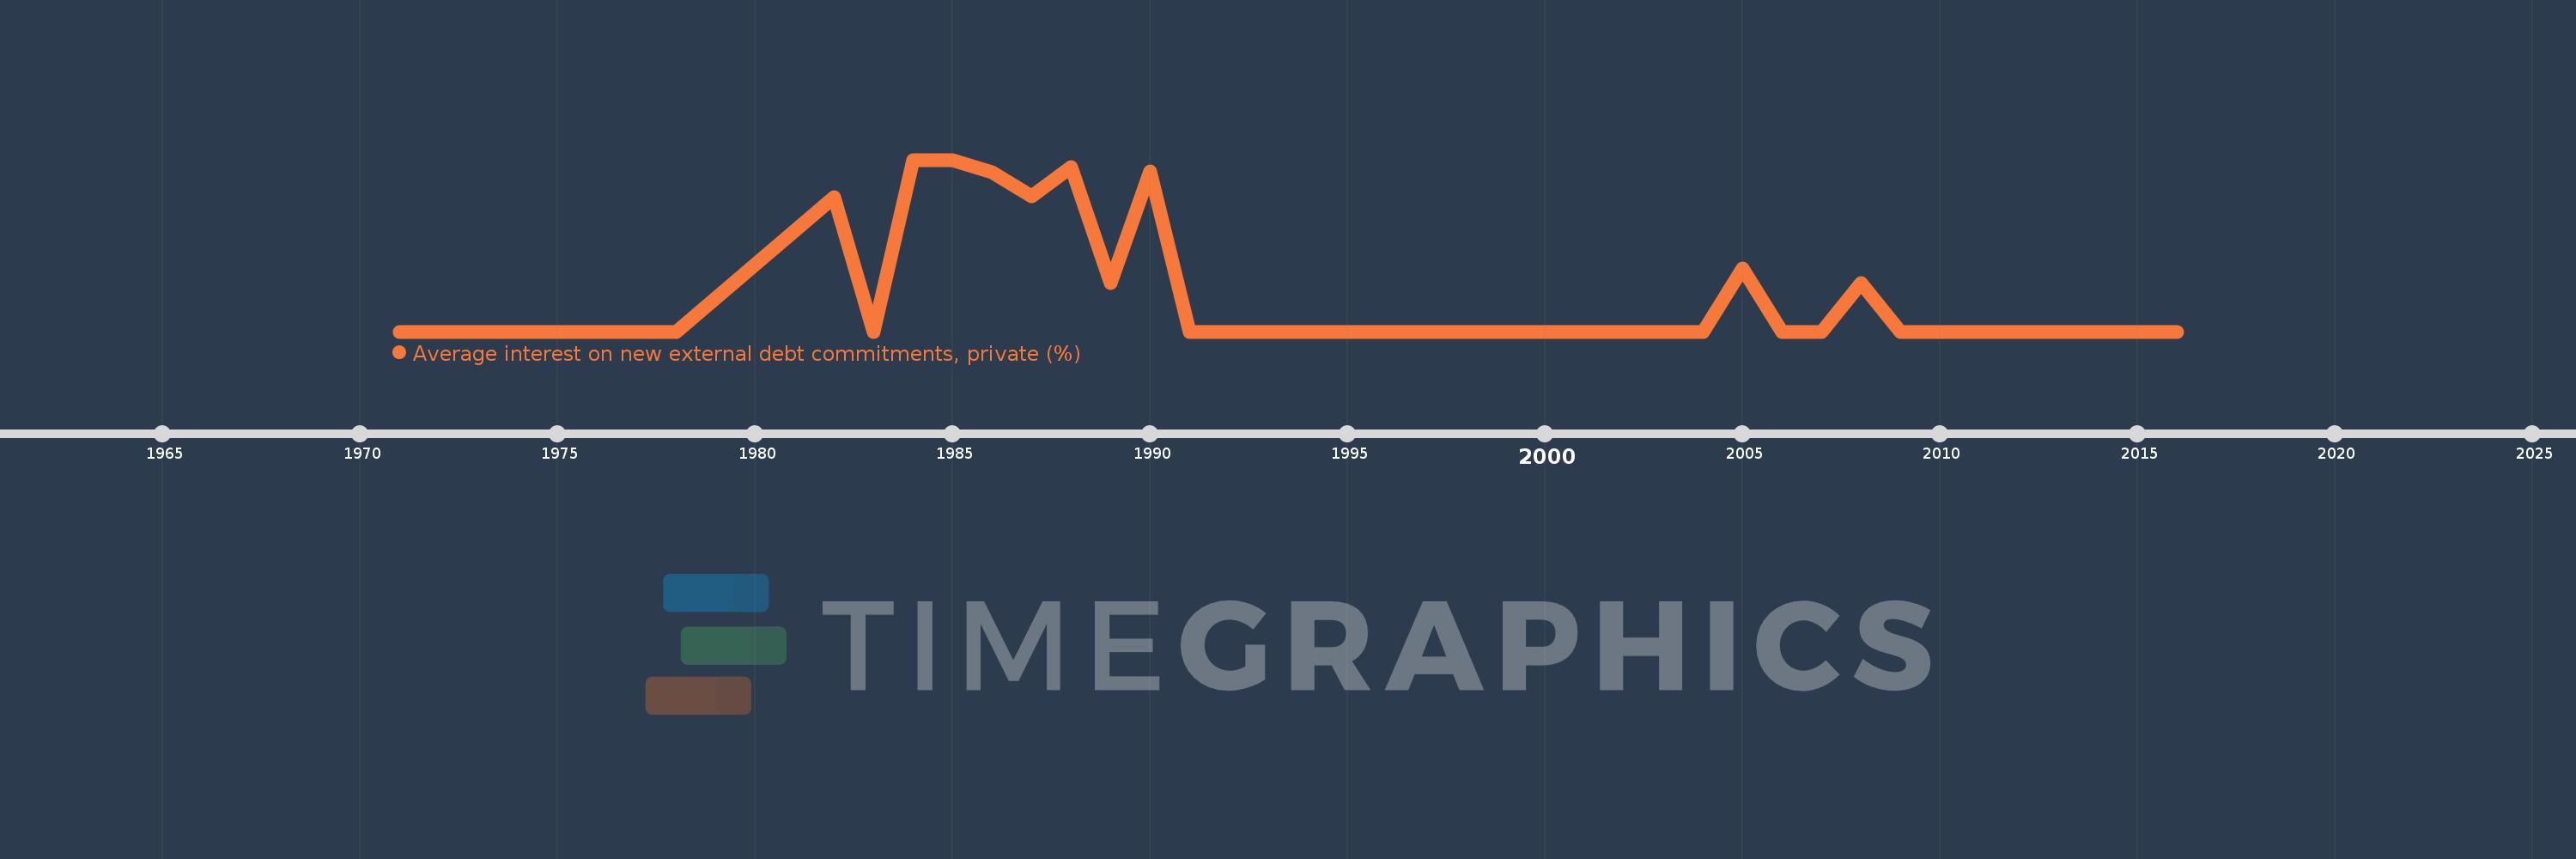
Average interest on new external debt commitments, private (%)
2016,2015,2014,2013,2012,2011,2010,2009,2008,2007,2006,2005,2004,2003,2002,2001,2000,1999,1998,1997,1996,1995,1994,1993,1992,1991,1990,1989,1988,1987,1986,1985,1984,1983,1982,1978,1977,1976,1975,1974,1973,1972,1971
This statistics in other country:
Timeline:
This timeline shows a graph from 1971 to 2016 of Nepal. No data until 1970. Number of actual observations by date: 43.
Source name:
World Development Indicators
Source organization:
World Bank, International Debt Statistics.
Categories, topics:
External Debt
Last updated:
apr 23, 2017
Indicators value changes by year
Maximum:
10.538
jan 1, 1985
At the date of observation
Value
Absolute change
Change from previous value
jan 1, 1983
0.0
-8.25
-100.0%
jan 1, 1985
10.538
+0.038
0.36%
jan 1, 1986
9.764
-0.774
-7.34%
jan 1, 1987
8.321
-1.443
-14.78%
jan 1, 1988
10.114
+1.793
21.55%
jan 1, 1989
3.0
-7.114
-70.34%
jan 1, 1990
9.85
+6.85
228.33%
jan 1, 1991
0.0
-9.85
-100.0%
jan 1, 2005
3.892
+3.892
%
jan 1, 2006
0.0
-3.892
-100.0%
jan 1, 2009
0.0
-3.0
-100.0%
Ranking of countries by current statistics by years


Comments: