29
/
en
AIzaSyAYiBZKx7MnpbEhh9jyipgxe19OcubqV5w
April 1, 2024
204956
Namibia
NAM
true
2
1
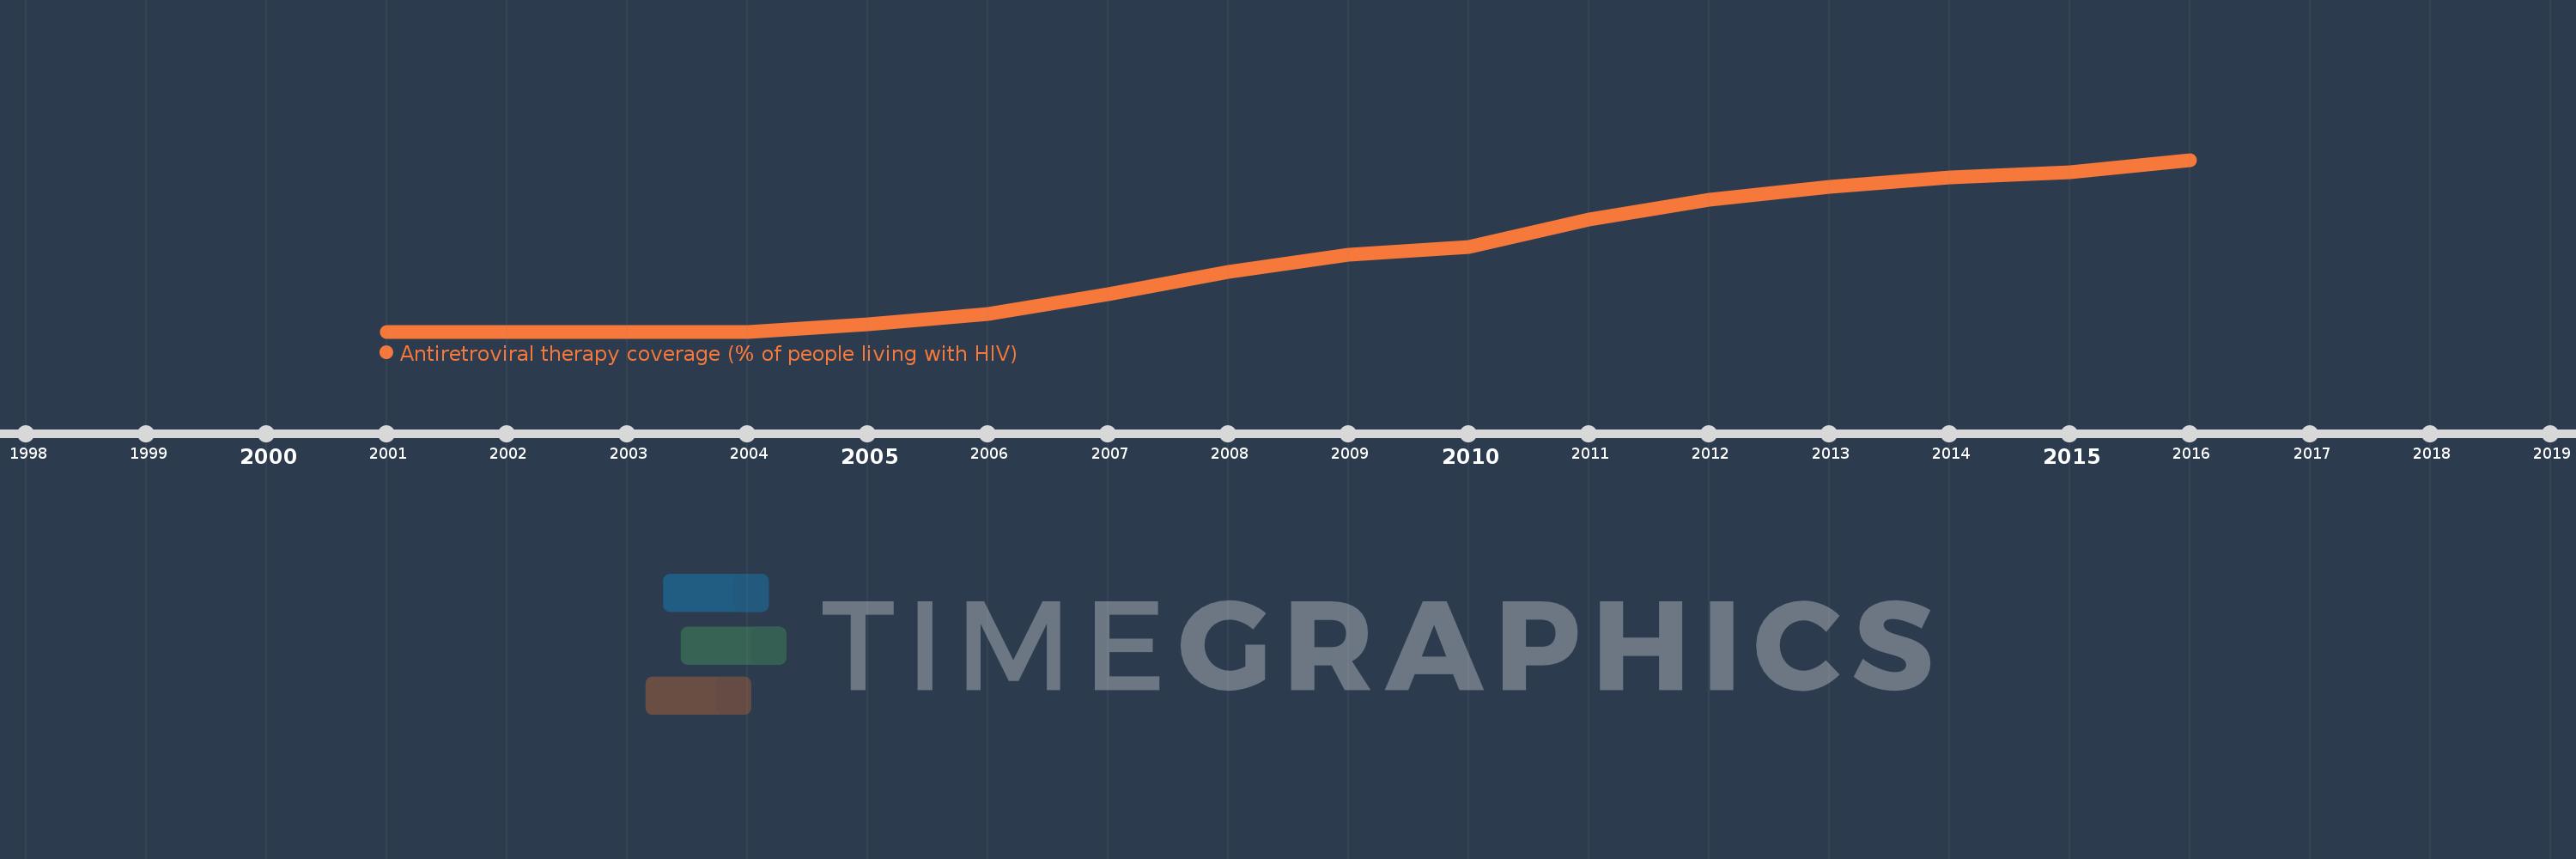
Antiretroviral therapy coverage (% of people living with HIV)
2016,2015,2014,2013,2012,2011,2010,2009,2008,2007,2006,2005,2004,2003,2002,2001
This statistics in other country:
Timeline:
This timeline shows a graph from 2001 to 2016 of Namibia. No data until 2000. Number of actual observations by date: 16.
Source name:
World Development Indicators
Source organization:
UNAIDS estimates.
Categories, topics:
Health
Last updated:
apr 23, 2017
Indicators value changes by year
At the date of observation
Value
Absolute change
Change from previous value
jan 1, 2006
7.0
+4.0
133.33%
jan 1, 2007
15.0
+8.0
114.29%
jan 1, 2008
24.0
+9.0
60.0%
jan 1, 2009
31.0
+7.0
29.17%
jan 1, 2010
34.0
+3.0
9.68%
jan 1, 2011
45.0
+11.0
32.35%
jan 1, 2012
53.0
+8.0
17.78%
jan 1, 2013
58.0
+5.0
9.43%
jan 1, 2014
62.0
+4.0
6.9%
jan 1, 2015
64.0
+2.0
3.23%
jan 1, 2016
69.0
+5.0
7.81%
Ranking of countries by current statistics by years


Comments: