29
/
en
AIzaSyAYiBZKx7MnpbEhh9jyipgxe19OcubqV5w
April 1, 2024
204923
Namibia
NAM
true
2
1
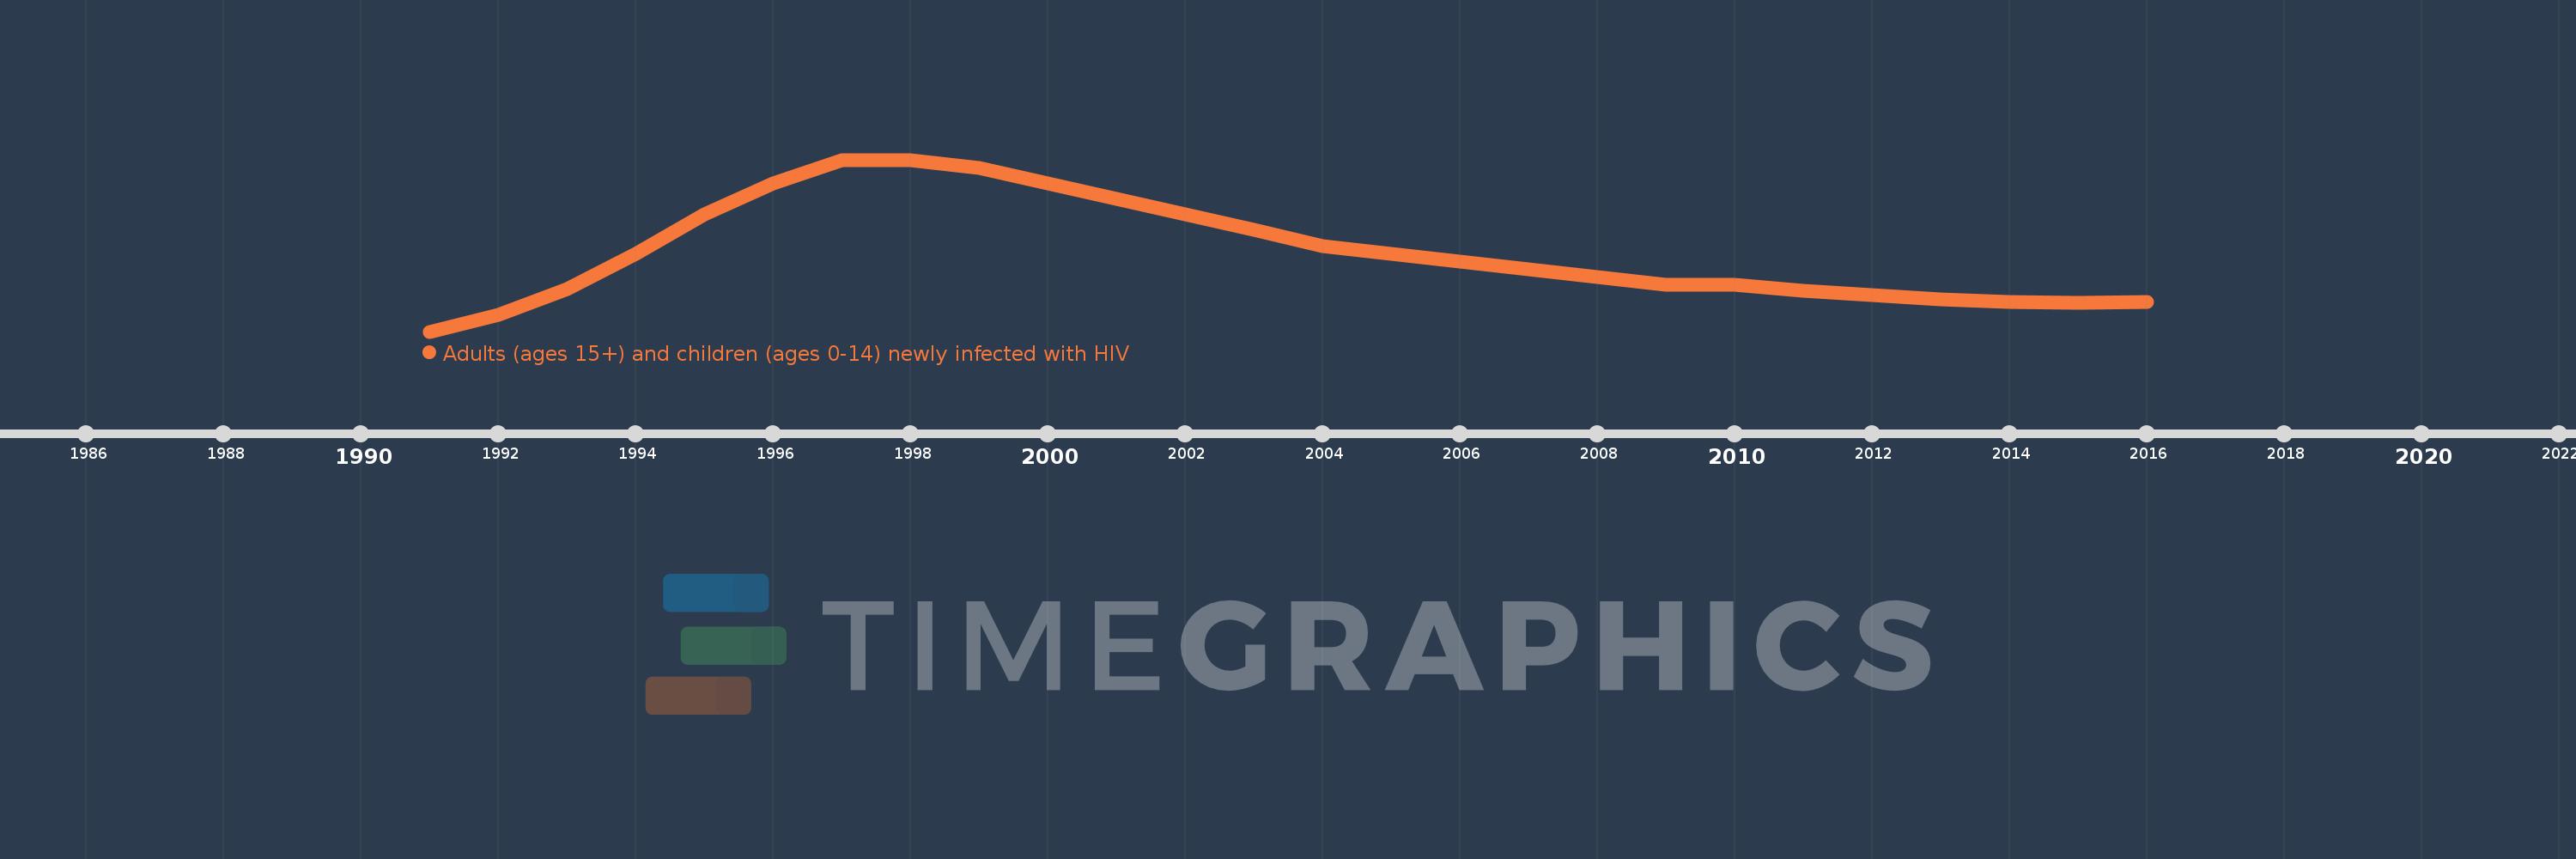
Adults (ages 15+) and children (ages 0-14) newly infected with HIV
2016,2015,2014,2013,2012,2011,2010,2009,2008,2007,2006,2005,2004,2003,2002,2001,2000,1999,1998,1997,1996,1995,1994,1993,1992,1991
This statistics in other country:
Timeline:
This timeline shows a graph from 1991 to 2016 of Namibia. No data until 1990. Number of actual observations by date: 26.
Source name:
World Development Indicators
Source organization:
UNAIDS estimates.
Categories, topics:
Health
Last updated:
apr 23, 2017
Indicators value changes by year
At the date of observation
Value
Absolute change
Change from previous value
jan 1, 1991
4.0K
+4.0K
0.0%
jan 1, 1992
6.2K
+2.2K
55.0%
jan 1, 1993
9.5K
+3.3K
53.23%
jan 1, 1994
14.0K
+4.5K
47.37%
jan 1, 1995
19.0K
+5.0K
35.71%
jan 1, 1996
23.0K
+4.0K
21.05%
jan 1, 1997
26.0K
+3.0K
13.04%
jan 1, 1998
26.0K
0.0
0.0%
jan 1, 1999
25.0K
-1000.0
-3.85%
jan 1, 2000
23.0K
-2.0K
-8.0%
jan 1, 2001
21.0K
-2.0K
-8.7%
jan 1, 2002
19.0K
-2.0K
-9.52%
jan 1, 2003
17.0K
-2.0K
-10.53%
jan 1, 2004
15.0K
-2.0K
-11.76%
jan 1, 2005
14.0K
-1000.0
-6.67%
jan 1, 2006
13.0K
-1000.0
-7.14%
jan 1, 2007
12.0K
-1000.0
-7.69%
jan 1, 2008
11.0K
-1000.0
-8.33%
jan 1, 2009
10.0K
-1000.0
-9.09%
jan 1, 2010
10.0K
0.0
0.0%
jan 1, 2011
9.2K
-800.0
-8.0%
jan 1, 2012
8.7K
-500.0
-5.43%
jan 1, 2013
8.1K
-600.0
-6.9%
jan 1, 2014
7.8K
-300.0
-3.7%
jan 1, 2015
7.7K
-100.0
-1.28%
jan 1, 2016
7.8K
+100.0
1.3%
Ranking of countries by current statistics by years


Comments: