29
/
en
AIzaSyAYiBZKx7MnpbEhh9jyipgxe19OcubqV5w
April 1, 2024
203736
Mozambique
MOZ
true
2
1
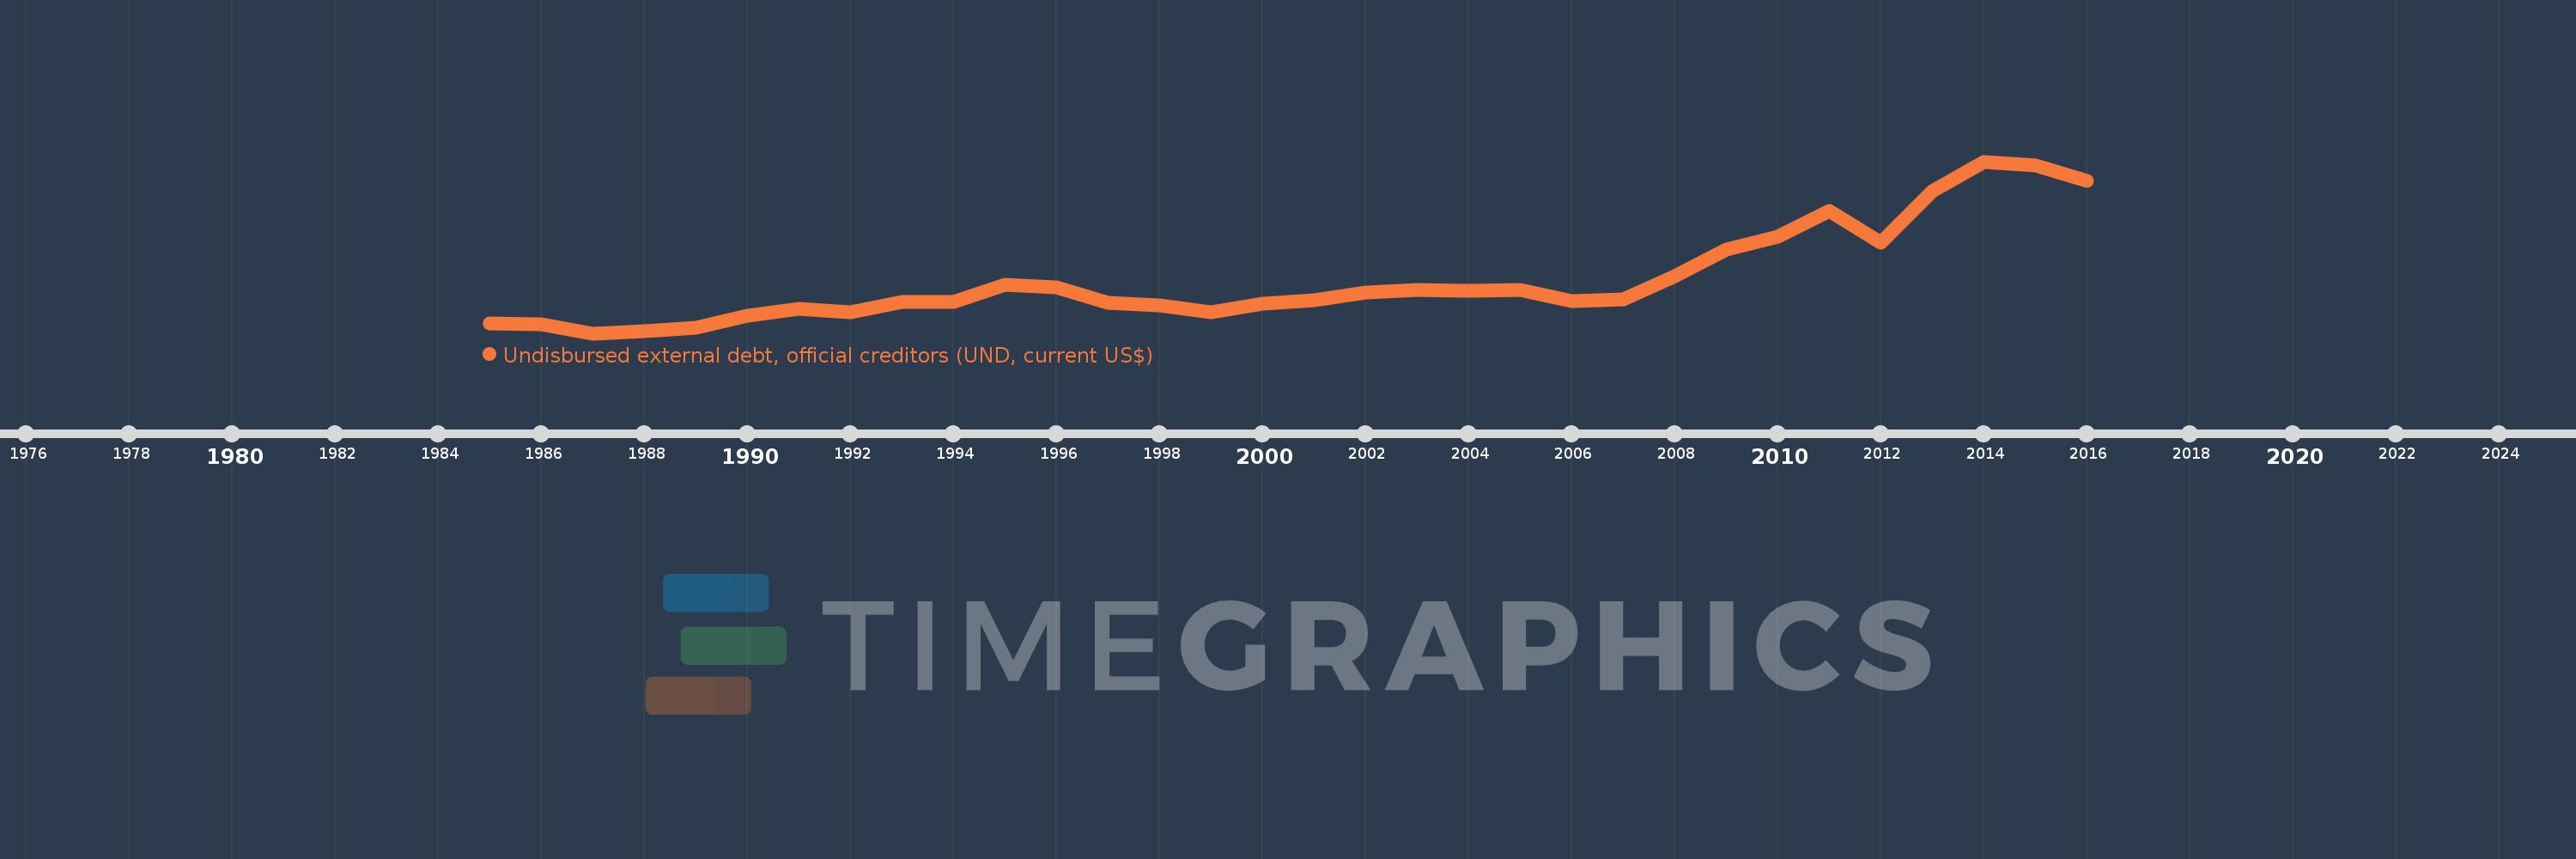
Undisbursed external debt, official creditors (UND, current US$)
2016,2015,2014,2013,2012,2011,2010,2009,2008,2007,2006,2005,2004,2003,2002,2001,2000,1999,1998,1997,1996,1995,1994,1993,1992,1991,1990,1989,1988,1987,1986,1985
This statistics in other country:
Timeline:
This timeline shows a graph from 1985 to 2016 of Mozambique. No data until 1984. Number of actual observations by date: 32.
Source name:
World Development Indicators
Source organization:
World Bank, International Debt Statistics.
Categories, topics:
External Debt
Last updated:
apr 23, 2017
Indicators value changes by year
Minimum:
524.568 mln
jan 1, 1987
Maximum:
4.234 bln
jan 1, 2014
At the date of observation
Value
Absolute change
Change from previous value
jan 1, 1985
739.488 mln
+739.488 mln
0.0%
jan 1, 1986
712.104 mln
-27.384 mln
-3.7%
jan 1, 1987
524.568 mln
-187.536 mln
-26.34%
jan 1, 1988
567.716 mln
+43.148 mln
8.23%
jan 1, 1989
636.838 mln
+69.122 mln
12.18%
jan 1, 1990
904.025 mln
+267.187 mln
41.96%
jan 1, 1991
1.058 bln
+154.111 mln
17.05%
jan 1, 1992
980.135 mln
-78.001 mln
-7.37%
jan 1, 1993
1.197 bln
+216.792 mln
22.12%
jan 1, 1994
1.2 bln
+3.498 mln
0.29%
jan 1, 1995
1.573 bln
+372.84 mln
31.06%
jan 1, 1996
1.512 bln
-61.527 mln
-3.91%
jan 1, 1997
1.182 bln
-330.21 mln
-21.84%
jan 1, 1998
1.129 bln
-52.206 mln
-4.42%
jan 1, 1999
973.184 mln
-156.138 mln
-13.83%
jan 1, 2000
1.16 bln
+187.065 mln
19.22%
jan 1, 2001
1.236 bln
+75.496 mln
6.51%
jan 1, 2002
1.404 bln
+168.344 mln
13.62%
jan 1, 2003
1.465 bln
+60.978 mln
4.34%
jan 1, 2004
1.446 bln
-18.73 mln
-1.28%
jan 1, 2005
1.455 bln
+8.714 mln
0.6%
jan 1, 2006
1.222 bln
-233.348 mln
-16.04%
jan 1, 2007
1.257 bln
+35.205 mln
2.88%
jan 1, 2008
1.756 bln
+498.91 mln
39.69%
jan 1, 2009
2.332 bln
+576.28 mln
32.82%
jan 1, 2010
2.614 bln
+282.016 mln
12.09%
jan 1, 2011
3.165 bln
+551.377 mln
21.09%
jan 1, 2012
2.477 bln
-688.164 mln
-21.74%
jan 1, 2013
3.601 bln
+1.124 bln
45.37%
jan 1, 2014
4.234 bln
+632.254 mln
17.56%
jan 1, 2015
4.155 bln
-78.294 mln
-1.85%
jan 1, 2016
3.819 bln
-336.654 mln
-8.1%
Ranking of countries by current statistics by years


Comments: