29
/
en
AIzaSyAYiBZKx7MnpbEhh9jyipgxe19OcubqV5w
April 1, 2024
203533
Mozambique
MOZ
true
2
1
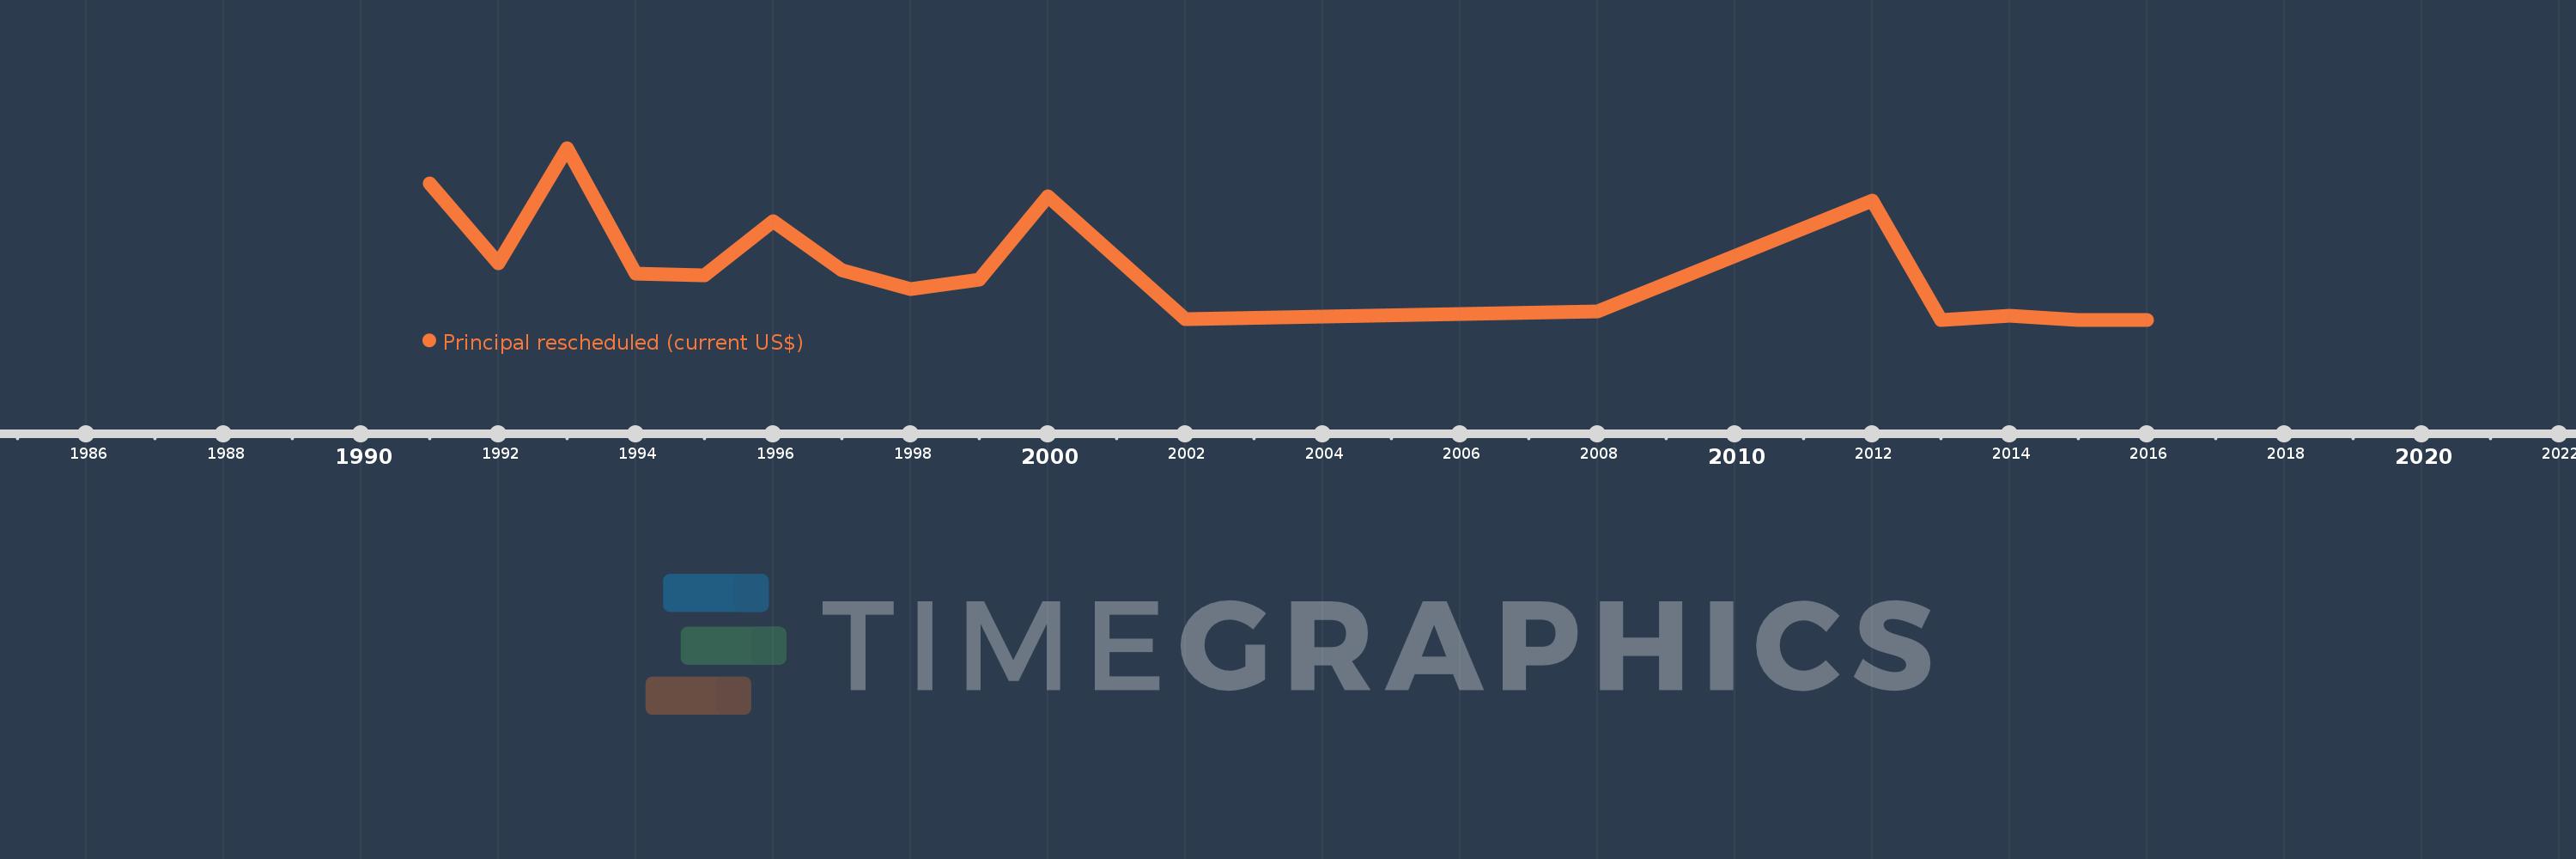
Principal rescheduled (current US$)
2016,2015,2014,2013,2012,2008,2002,2000,1999,1998,1997,1996,1995,1994,1993,1992,1991
This statistics in other country:
Timeline:
This timeline shows a graph from 1991 to 2016 of Mozambique. No data until 1990. Number of actual observations by date: 17.
Source name:
World Development Indicators
Source organization:
World Bank, International Debt Statistics.
Categories, topics:
External Debt
Last updated:
apr 23, 2017
Indicators value changes by year
Maximum:
282.968 mln
jan 1, 1993
At the date of observation
Value
Absolute change
Change from previous value
jan 1, 1991
224.899 mln
+224.899 mln
0.0%
jan 1, 1992
93.452 mln
-131.447 mln
-58.45%
jan 1, 1993
282.968 mln
+189.516 mln
202.8%
jan 1, 1994
75.765 mln
-207.203 mln
-73.22%
jan 1, 1995
73.335 mln
-2.43 mln
-3.21%
jan 1, 1996
161.677 mln
+88.342 mln
120.46%
jan 1, 1997
81.519 mln
-80.158 mln
-49.58%
jan 1, 1998
50.287 mln
-31.232 mln
-38.31%
jan 1, 1999
65.981 mln
+15.694 mln
31.21%
jan 1, 2000
203.912 mln
+137.931 mln
209.05%
jan 1, 2002
1.547 mln
-202.365 mln
-99.24%
jan 1, 2008
14.087 mln
+12.54 mln
810.6%
jan 1, 2012
196.776 mln
+182.689 mln
1.3K%
jan 1, 2013
0.0
-196.776 mln
-100.0%
jan 1, 2014
6.724 mln
+6.724 mln
%
jan 1, 2015
0.0
-6.724 mln
-100.0%
Ranking of countries by current statistics by years


Comments: