29
/
en
AIzaSyAYiBZKx7MnpbEhh9jyipgxe19OcubqV5w
April 1, 2024
203477
Mozambique
MOZ
true
2
1
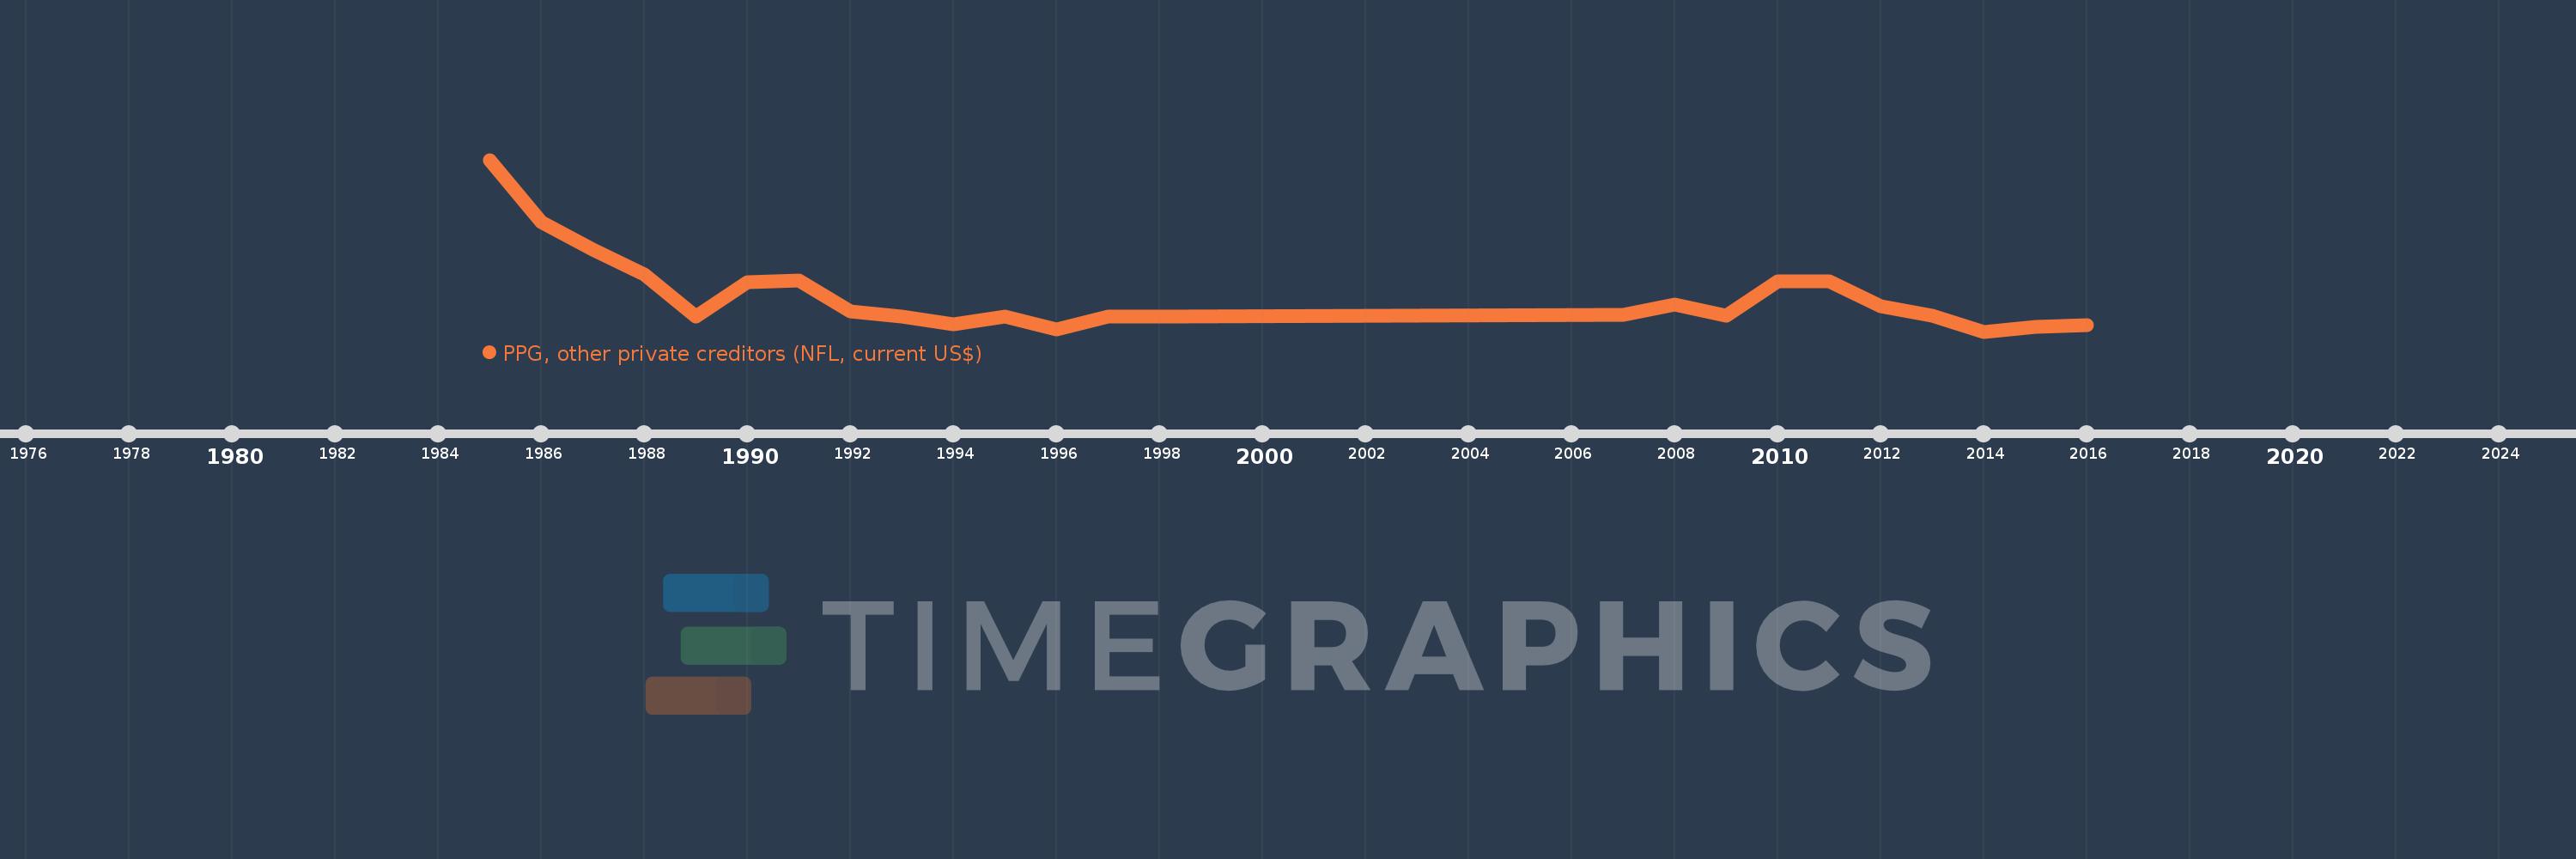
PPG, other private creditors (NFL, current US$)
2016,2015,2014,2013,2012,2011,2010,2009,2008,2007,1998,1997,1996,1995,1994,1993,1992,1991,1990,1989,1988,1987,1986,1985
This statistics in other country:
Timeline:
This timeline shows a graph from 1985 to 2016 of Mozambique. No data until 1984. Number of actual observations by date: 24.
Source name:
World Development Indicators
Source organization:
World Bank, International Debt Statistics.
Categories, topics:
External Debt
Last updated:
apr 23, 2017
Indicators value changes by year
Minimum:
-10.165 mln
jan 1, 2014
Maximum:
93.299 mln
jan 1, 1985
At the date of observation
Value
Absolute change
Change from previous value
jan 1, 1985
93.299 mln
+93.299 mln
0.0%
jan 1, 1986
55.885 mln
-37.414 mln
-40.1%
jan 1, 1987
39.014 mln
-16.871 mln
-30.19%
jan 1, 1988
24.177 mln
-14.837 mln
-38.03%
jan 1, 1989
-1.23 mln
-25.407 mln
-105.09%
jan 1, 1990
19.444 mln
+20.674 mln
-1.68K%
jan 1, 1991
20.643 mln
+1.199 mln
6.17%
jan 1, 1992
2.148 mln
-18.495 mln
-89.59%
jan 1, 1993
-1.279 mln
-3.427 mln
-159.54%
jan 1, 1994
-6.011 mln
-4.732 mln
369.98%
jan 1, 1995
-1.283 mln
+4.728 mln
-78.66%
jan 1, 1996
-9.123 mln
-7.84 mln
611.07%
jan 1, 1997
-1.233 mln
+7.89 mln
-86.48%
jan 1, 1998
-941.0K
+292.0K
-23.68%
jan 1, 2007
0.0
+941.0K
-100.0%
jan 1, 2008
6.206 mln
+6.206 mln
%
jan 1, 2009
-846.0K
-7.052 mln
-113.63%
jan 1, 2010
20.356 mln
+21.202 mln
-2.51K%
jan 1, 2011
20.225 mln
-131.0K
-0.64%
jan 1, 2012
5.344 mln
-14.881 mln
-73.58%
jan 1, 2013
-466.0K
-5.81 mln
-108.72%
jan 1, 2014
-10.165 mln
-9.699 mln
2.08K%
jan 1, 2015
-7.113 mln
+3.052 mln
-30.02%
jan 1, 2016
-6.127 mln
+986.0K
-13.86%
Ranking of countries by current statistics by years


Comments: