29
/
en
AIzaSyAYiBZKx7MnpbEhh9jyipgxe19OcubqV5w
April 1, 2024
202992
Mozambique
MOZ
true
2
1
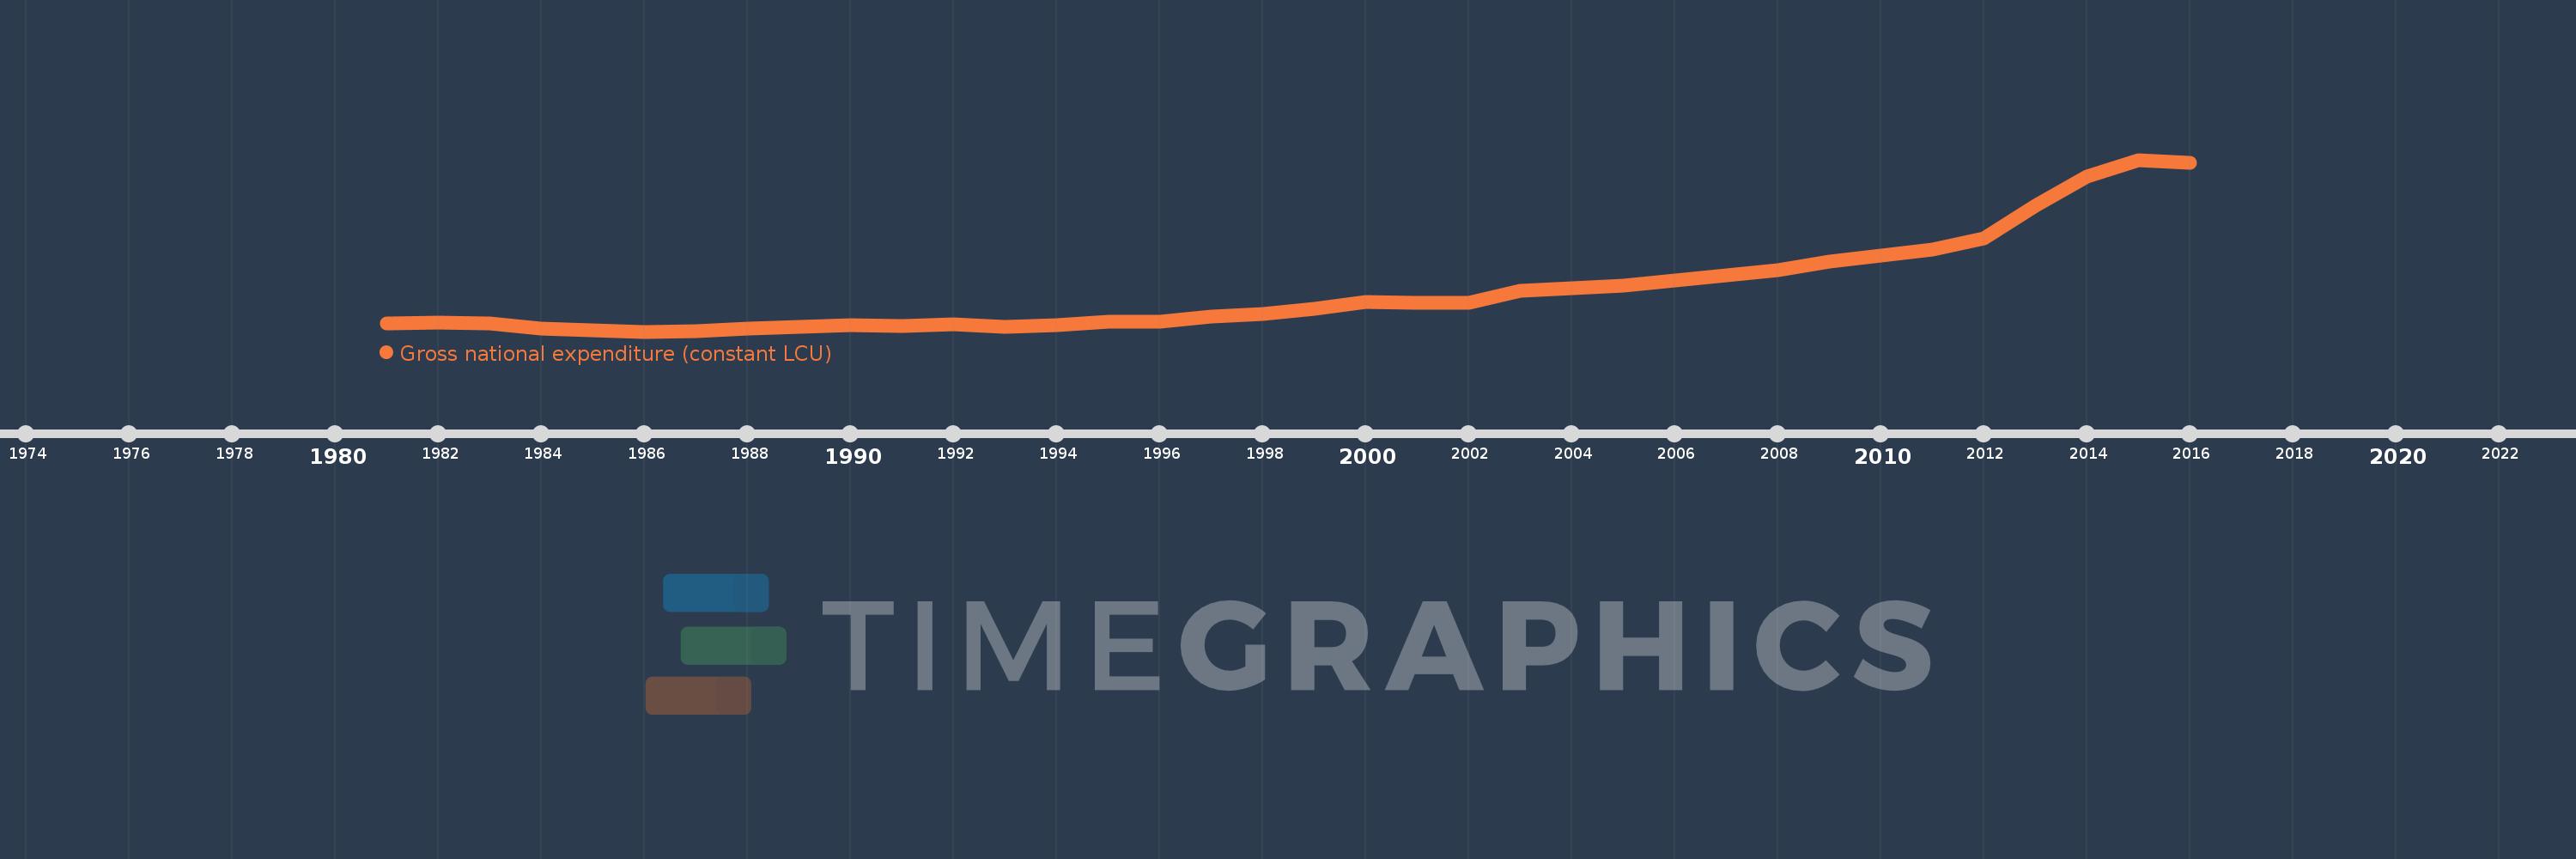
Gross national expenditure (constant LCU)
2016,2015,2014,2013,2012,2011,2010,2009,2008,2007,2006,2005,2004,2003,2002,2001,2000,1999,1998,1997,1996,1995,1994,1993,1992,1991,1990,1989,1988,1987,1986,1985,1984,1983,1982,1981
This statistics in other country:
AlbaniaAlgeriaAngolaAntigua and BarbudaArgentinaArmeniaAustraliaAustriaAzerbaijanBahamas, TheBahrainBangladeshBarbadosBelarusBelgiumBelizeBeninBhutanBoliviaBosnia and HerzegovinaBotswanaBrazilBrunei DarussalamBulgariaBurkina FasoBurundiCabo VerdeCambodiaCameroonCanadaChadChileChinaColombiaComorosCongo, Dem. Rep.Congo, Rep.Costa RicaCote d'IvoireCroatiaCubaCyprusCzech RepublicDenmarkDjiboutiDominican RepublicEcuadorEgypt, Arab Rep.El SalvadorEquatorial GuineaEritreaEstoniaEthiopiaFijiFinlandFranceGabonGambia, TheGeorgiaGermanyGhanaGreeceGuatemalaGuineaGuinea-BissauHaitiHondurasHong Kong SAR, ChinaHungaryIcelandIndiaIndonesiaIran, Islamic Rep.IrelandIsraelItalyJamaicaJapanJordanKazakhstanKenyaKorea, Rep.KosovoKuwaitKyrgyz RepublicLao PDRLatviaLebanonLiberiaLibyaLithuaniaLuxembourgMacao SAR, ChinaMacedonia, FYRMadagascarMalawiMalaysiaMaliMaltaMauritaniaMauritiusMexicoMoldovaMongoliaMontenegroMoroccoMozambiqueMyanmarNamibiaNepalNetherlandsNew ZealandNicaraguaNigerNigeriaNorwayOmanPakistanPanamaPapua New GuineaParaguayPeruPhilippinesPolandPortugalPuerto RicoQatarRomaniaRussian FederationRwandaSamoaSaudi ArabiaSenegalSerbiaSeychellesSierra LeoneSingaporeSlovak RepublicSloveniaSomaliaSouth AfricaSouth SudanSpainSri LankaSudanSurinameSwazilandSwedenSwitzerlandSyrian Arab RepublicTajikistanTanzaniaThailandTimor-LesteTogoTrinidad and TobagoTunisiaTurkeyTurkmenistanUgandaUkraineUnited Arab EmiratesUnited KingdomUnited StatesUruguayUzbekistanVanuatuVenezuela, RBVietnamWest Bank and GazaZambiaZimbabwe Timeline:
This timeline shows a graph from 1981 to 2016 of Mozambique. No data until 1980. Number of actual observations by date: 36.
Source name:
World Development Indicators
Source organization:
World Bank national accounts data, and OECD National Accounts data files.
Categories, topics:
Economy & Growth
Last updated:
apr 23, 2017
Indicators value changes by year
Minimum:
77.292 bln
jan 1, 1986
Maximum:
659.342 bln
jan 1, 2015
At the date of observation
Value
Absolute change
Change from previous value
jan 1, 1981
105.897 bln
+105.897 bln
0.0%
jan 1, 1982
106.999 bln
+1.102 bln
1.04%
jan 1, 1983
104.083 bln
-2.917 bln
-2.73%
jan 1, 1984
87.49 bln
-16.593 bln
-15.94%
jan 1, 1985
82.217 bln
-5.273 bln
-6.03%
jan 1, 1986
77.292 bln
-4.925 bln
-5.99%
jan 1, 1987
78.86 bln
+1.568 bln
2.03%
jan 1, 1988
87.751 bln
+8.891 bln
11.27%
jan 1, 1989
91.914 bln
+4.162 bln
4.74%
jan 1, 1990
98.734 bln
+6.82 bln
7.42%
jan 1, 1991
97.265 bln
-1.469 bln
-1.49%
jan 1, 1992
100.624 bln
+3.359 bln
3.45%
jan 1, 1993
93.667 bln
-6.957 bln
-6.91%
jan 1, 1994
99.974 bln
+6.307 bln
6.73%
jan 1, 1995
109.576 bln
+9.602 bln
9.6%
jan 1, 1996
110.327 bln
+751.304 mln
0.69%
jan 1, 1997
127.287 bln
+16.96 bln
15.37%
jan 1, 1998
138.09 bln
+10.803 bln
8.49%
jan 1, 1999
153.415 bln
+15.325 bln
11.1%
jan 1, 2000
177.821 bln
+24.406 bln
15.91%
jan 1, 2001
174.725 bln
-3.096 bln
-1.74%
jan 1, 2002
174.672 bln
-53.24 mln
-0.03%
jan 1, 2003
216.959 bln
+42.287 bln
24.21%
jan 1, 2004
225.109 bln
+8.15 bln
3.76%
jan 1, 2005
232.102 bln
+6.994 bln
3.11%
jan 1, 2006
251.075 bln
+18.973 bln
8.17%
jan 1, 2007
267.252 bln
+16.177 bln
6.44%
jan 1, 2008
286.263 bln
+19.011 bln
7.11%
jan 1, 2009
313.91 bln
+27.648 bln
9.66%
jan 1, 2010
334.224 bln
+20.314 bln
6.47%
jan 1, 2011
354.943 bln
+20.72 bln
6.2%
jan 1, 2012
394.321 bln
+39.378 bln
11.09%
jan 1, 2013
503.521 bln
+109.2 bln
27.69%
jan 1, 2014
601.291 bln
+97.77 bln
19.42%
jan 1, 2015
659.342 bln
+58.051 bln
9.65%
jan 1, 2016
649.485 bln
-9.857 bln
-1.5%
Ranking of countries by current statistics by years


Comments: