29
/
en
AIzaSyAYiBZKx7MnpbEhh9jyipgxe19OcubqV5w
April 1, 2024
201991
Morocco
MAR
true
2
1
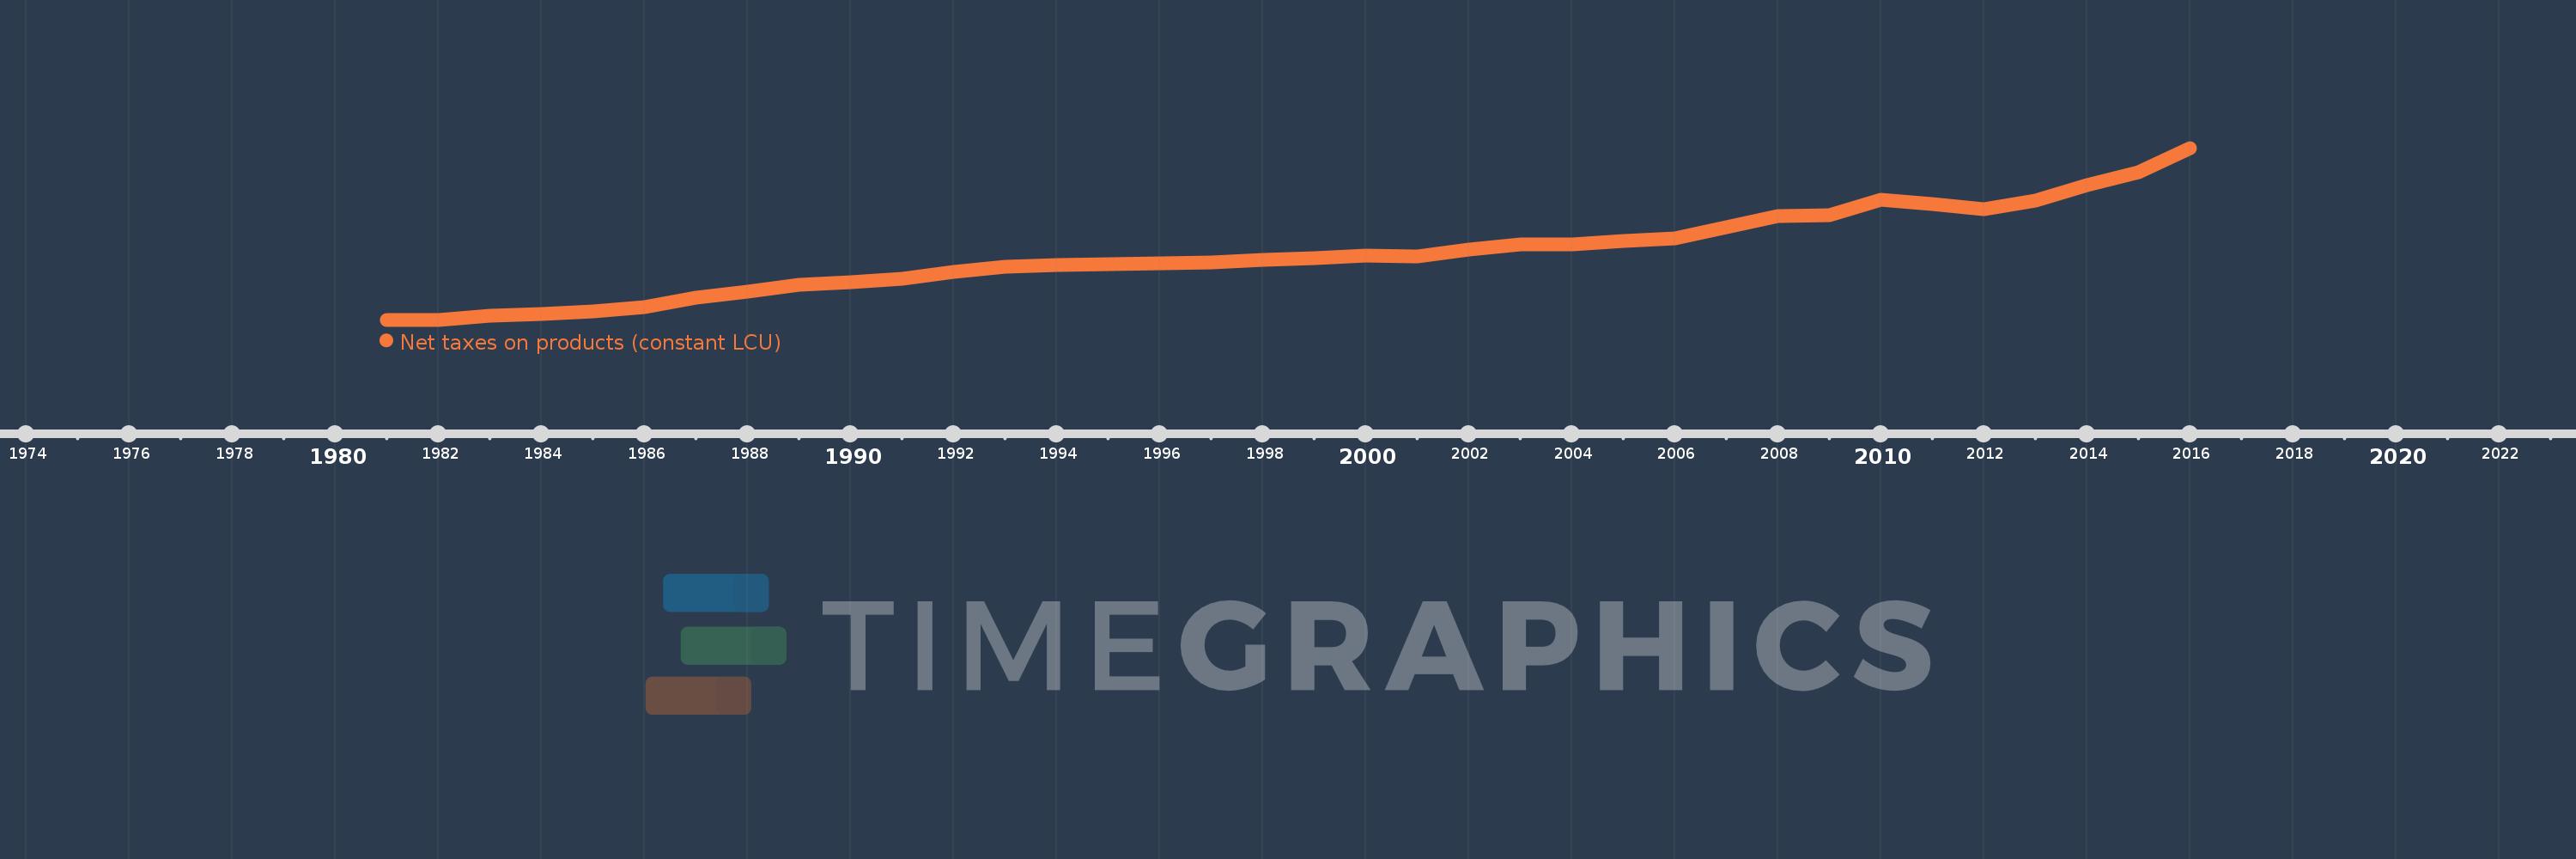
Net taxes on products (constant LCU)
2016,2015,2014,2013,2012,2011,2010,2009,2008,2007,2006,2005,2004,2003,2002,2001,2000,1999,1998,1997,1996,1995,1994,1993,1992,1991,1990,1989,1988,1987,1986,1985,1984,1983,1982,1981
This statistics in other country:
Timeline:
This timeline shows a graph from 1981 to 2016 of Morocco. No data until 1980. Number of actual observations by date: 36.
Source name:
World Development Indicators
Source organization:
World Bank national accounts data, and OECD National Accounts data files.
Categories, topics:
Economy & Growth
Last updated:
apr 23, 2017
Indicators value changes by year
Minimum:
9.842 bln
jan 1, 1981
Maximum:
111.092 bln
jan 1, 2016
At the date of observation
Value
Absolute change
Change from previous value
jan 1, 1981
9.842 bln
+9.842 bln
0.0%
jan 1, 1982
9.924 bln
+81.934 mln
0.83%
jan 1, 1983
12.09 bln
+2.166 bln
21.82%
jan 1, 1984
13.203 bln
+1.114 bln
9.21%
jan 1, 1985
14.772 bln
+1.568 bln
11.88%
jan 1, 1986
17.344 bln
+2.572 bln
17.41%
jan 1, 1987
22.727 bln
+5.383 bln
31.04%
jan 1, 1988
26.158 bln
+3.43 bln
15.09%
jan 1, 1989
30.49 bln
+4.332 bln
16.56%
jan 1, 1990
31.897 bln
+1.406 bln
4.61%
jan 1, 1991
34.013 bln
+2.117 bln
6.64%
jan 1, 1992
38.095 bln
+4.082 bln
12.0%
jan 1, 1993
41.143 bln
+3.048 bln
8.0%
jan 1, 1994
41.965 bln
+822.85 mln
2.0%
jan 1, 1995
42.385 bln
+419.66 mln
1.0%
jan 1, 1996
42.94 bln
+554.46 mln
1.31%
jan 1, 1997
43.369 bln
+429.39 mln
1.0%
jan 1, 1998
45.104 bln
+1.735 bln
4.0%
jan 1, 1999
46.005 bln
+901.7 mln
2.0%
jan 1, 2000
47.604 bln
+1.598 bln
3.47%
jan 1, 2001
47.349 bln
-254.68 mln
-0.53%
jan 1, 2002
51.297 bln
+3.947 bln
8.34%
jan 1, 2003
54.259 bln
+2.962 bln
5.78%
jan 1, 2004
54.231 bln
-28.44 mln
-0.05%
jan 1, 2005
56.502 bln
+2.272 bln
4.19%
jan 1, 2006
57.851 bln
+1.349 bln
2.39%
jan 1, 2007
64.113 bln
+6.262 bln
10.82%
jan 1, 2008
70.911 bln
+6.798 bln
10.6%
jan 1, 2009
71.398 bln
+487.0 mln
0.69%
jan 1, 2010
80.342 bln
+8.944 bln
12.53%
jan 1, 2011
78.058 bln
-2.284 bln
-2.84%
jan 1, 2012
75.098 bln
-2.96 bln
-3.79%
jan 1, 2013
80.169 bln
+5.071 bln
6.75%
jan 1, 2014
89.29 bln
+9.121 bln
11.38%
jan 1, 2015
96.819 bln
+7.529 bln
8.43%
jan 1, 2016
111.092 bln
+14.273 bln
14.74%
Ranking of countries by current statistics by years


Comments: