29
/
en
AIzaSyAYiBZKx7MnpbEhh9jyipgxe19OcubqV5w
April 1, 2024
200879
Montenegro
MNE
true
2
1
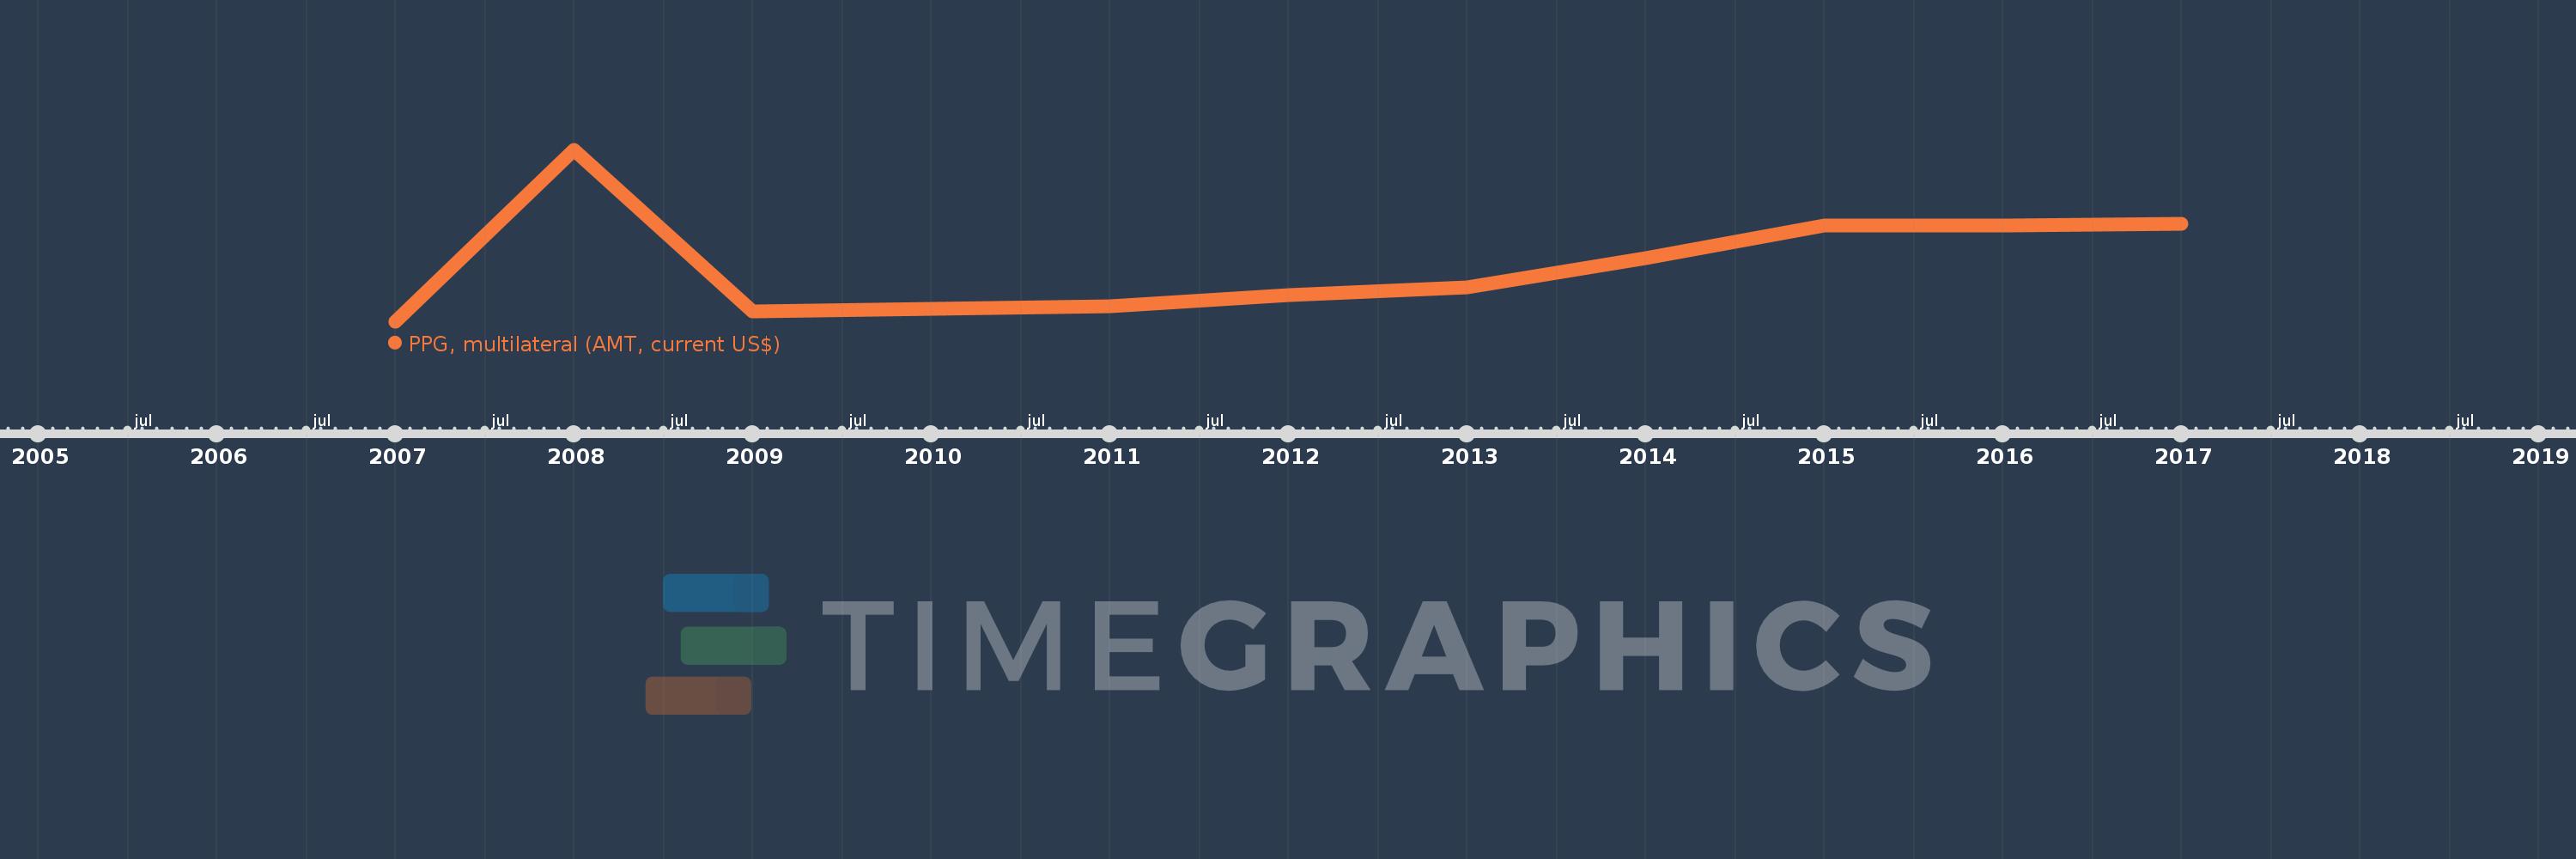
PPG, multilateral (AMT, current US$)
2017,2016,2015,2014,2013,2012,2011,2010,2009,2008,2007
This statistics in other country:
Timeline:
This timeline shows a graph from 2007 to 2017 of Montenegro. No data until 2006. Number of actual observations by date: 11.
Source name:
World Development Indicators
Source organization:
World Bank, International Debt Statistics.
Categories, topics:
External Debt
Last updated:
apr 23, 2017
Indicators value changes by year
Minimum:
8.306 mln
jan 1, 2007
Maximum:
98.317 mln
jan 1, 2008
At the date of observation
Value
Absolute change
Change from previous value
jan 1, 2007
8.306 mln
+8.306 mln
0.0%
jan 1, 2008
98.317 mln
+90.011 mln
1.08K%
jan 1, 2009
14.007 mln
-84.31 mln
-85.75%
jan 1, 2010
15.162 mln
+1.155 mln
8.25%
jan 1, 2011
16.32 mln
+1.158 mln
7.64%
jan 1, 2012
22.441 mln
+6.121 mln
37.51%
jan 1, 2013
26.534 mln
+4.093 mln
18.24%
jan 1, 2014
41.662 mln
+15.128 mln
57.01%
jan 1, 2015
59.015 mln
+17.353 mln
41.65%
jan 1, 2016
58.923 mln
-92.0K
-0.16%
jan 1, 2017
59.722 mln
+799.0K
1.36%
Ranking of countries by current statistics by years


Comments: