29
/
en
AIzaSyAYiBZKx7MnpbEhh9jyipgxe19OcubqV5w
April 1, 2024
199704
Mongolia
MNG
true
2
1
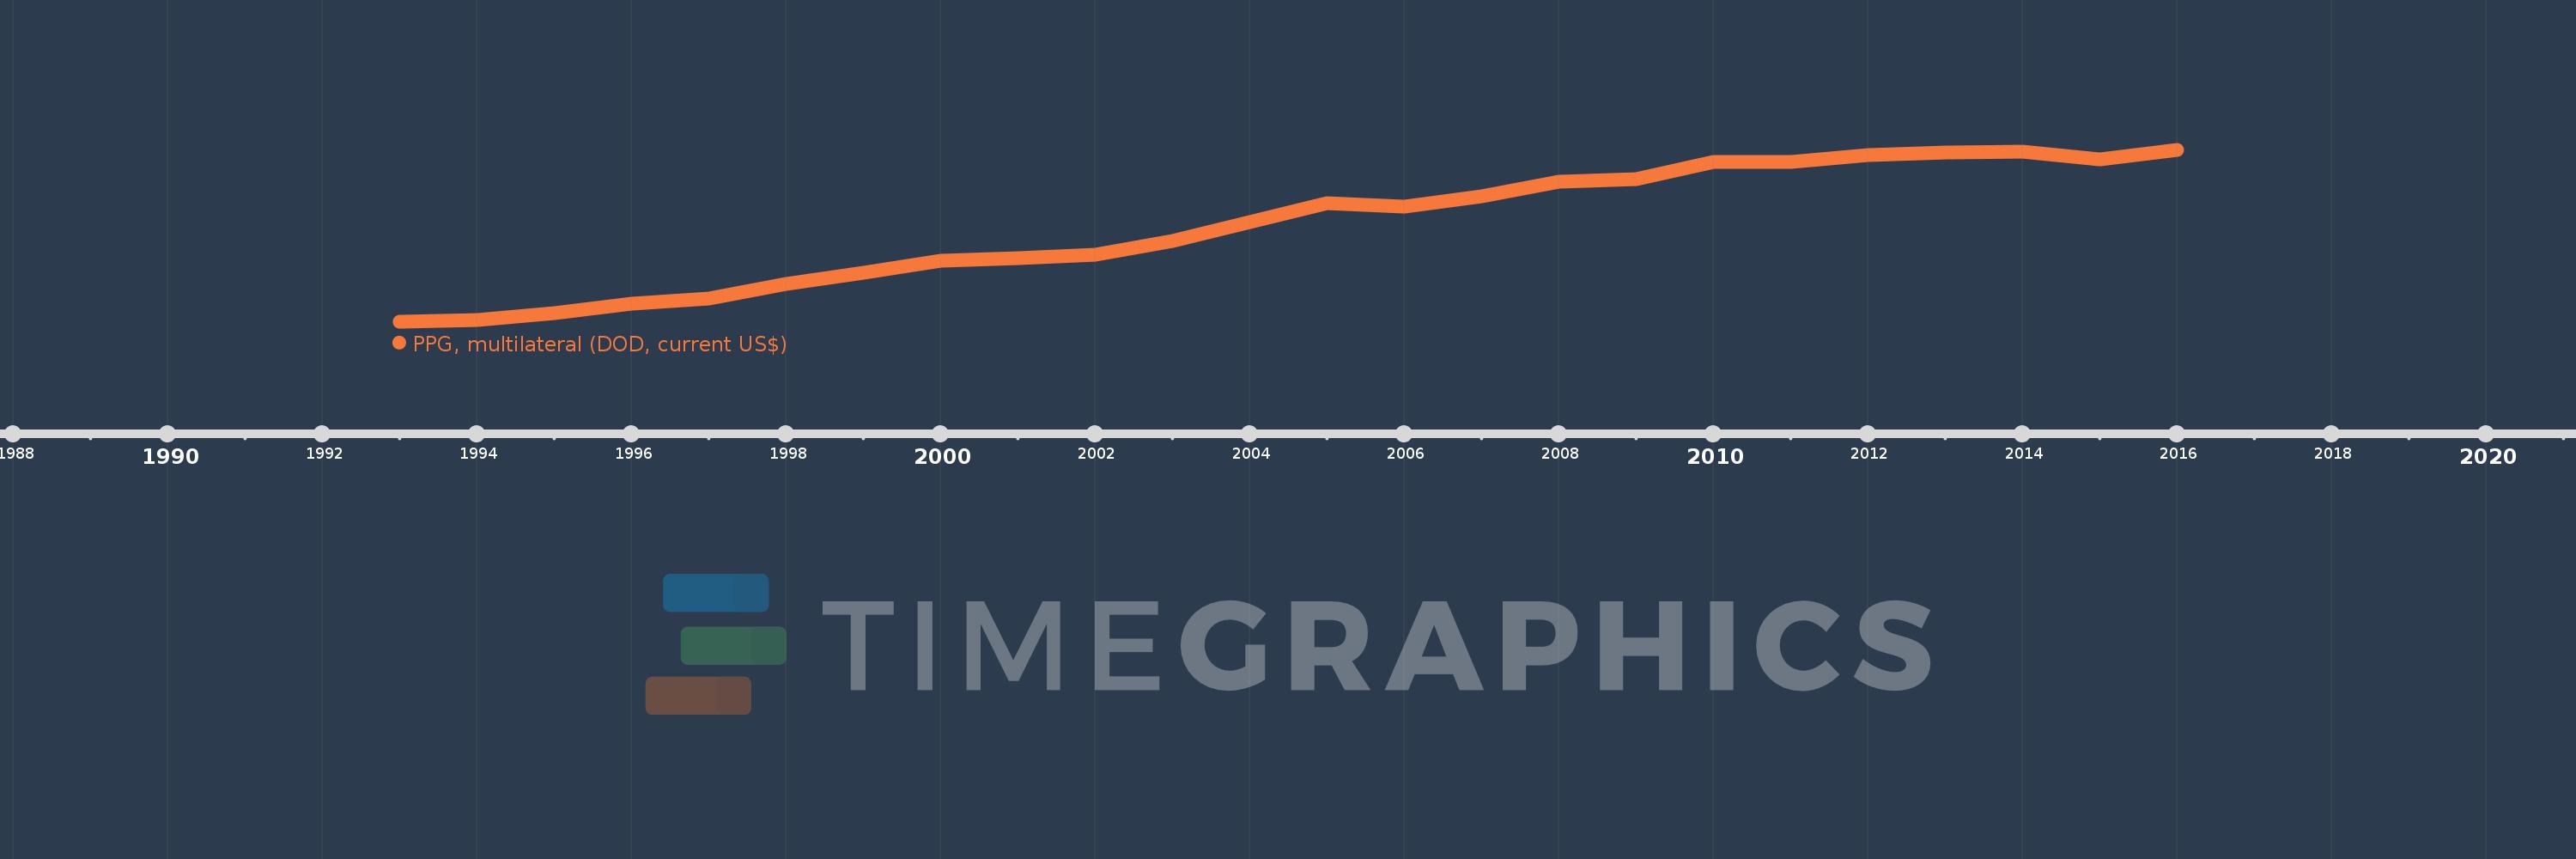
PPG, multilateral (DOD, current US$)
2016,2015,2014,2013,2012,2011,2010,2009,2008,2007,2006,2005,2004,2003,2002,2001,2000,1999,1998,1997,1996,1995,1994,1993
This statistics in other country:
Timeline:
This timeline shows a graph from 1993 to 2016 of Mongolia. No data until 1992. Number of actual observations by date: 24.
Source name:
World Development Indicators
Source organization:
World Bank, International Debt Statistics.
Categories, topics:
External Debt
Last updated:
apr 23, 2017
Indicators value changes by year
Minimum:
56.396 mln
jan 1, 1993
Maximum:
1.145 bln
jan 1, 2016
At the date of observation
Value
Absolute change
Change from previous value
jan 1, 1993
56.396 mln
+56.396 mln
0.0%
jan 1, 1994
71.483 mln
+15.087 mln
26.75%
jan 1, 1995
113.059 mln
+41.576 mln
58.16%
jan 1, 1996
169.889 mln
+56.83 mln
50.27%
jan 1, 1997
205.948 mln
+36.059 mln
21.23%
jan 1, 1998
295.893 mln
+89.945 mln
43.67%
jan 1, 1999
367.849 mln
+71.956 mln
24.32%
jan 1, 2000
446.748 mln
+78.899 mln
21.45%
jan 1, 2001
462.052 mln
+15.304 mln
3.43%
jan 1, 2002
483.402 mln
+21.35 mln
4.62%
jan 1, 2003
567.292 mln
+83.89 mln
17.35%
jan 1, 2004
688.032 mln
+120.74 mln
21.28%
jan 1, 2005
809.604 mln
+121.572 mln
17.67%
jan 1, 2006
787.089 mln
-22.515 mln
-2.78%
jan 1, 2007
853.854 mln
+66.765 mln
8.48%
jan 1, 2008
944.458 mln
+90.604 mln
10.61%
jan 1, 2009
964.249 mln
+19.791 mln
2.1%
jan 1, 2010
1.069 bln
+105.131 mln
10.9%
jan 1, 2011
1.073 bln
+3.429 mln
0.32%
jan 1, 2012
1.113 bln
+40.23 mln
3.75%
jan 1, 2013
1.132 bln
+18.849 mln
1.69%
jan 1, 2014
1.137 bln
+4.812 mln
0.43%
jan 1, 2015
1.089 bln
-47.241 mln
-4.16%
jan 1, 2016
1.145 bln
+56.026 mln
5.14%
Ranking of countries by current statistics by years


Comments: