29
/
en
AIzaSyAYiBZKx7MnpbEhh9jyipgxe19OcubqV5w
April 1, 2024
199639
Mongolia
MNG
true
2
1
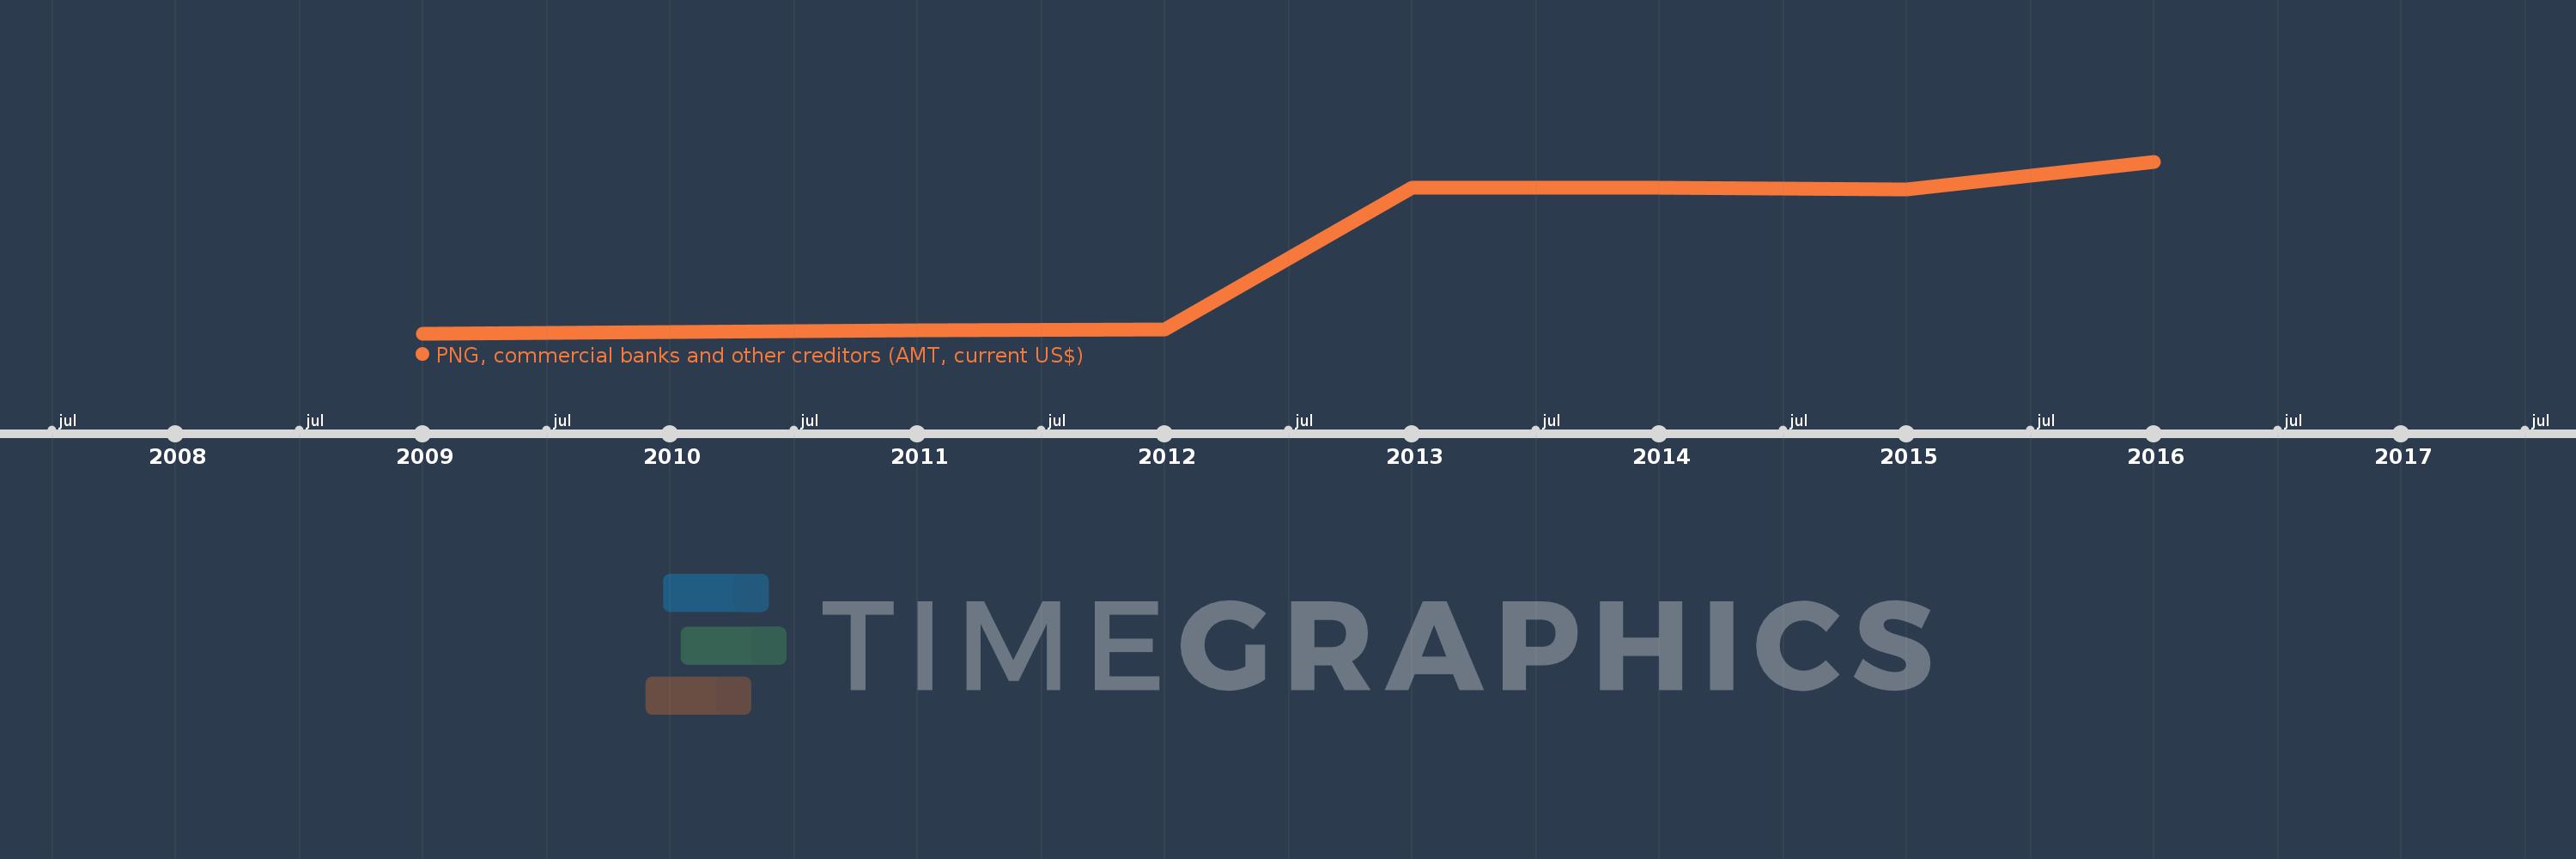
PNG, commercial banks and other creditors (AMT, current US$)
2016,2015,2014,2013,2012,2011,2010,2009
This statistics in other country:
Timeline:
This timeline shows a graph from 2009 to 2016 of Mongolia. No data until 2008. Number of actual observations by date: 8.
Source name:
World Development Indicators
Source organization:
World Bank, International Debt Statistics.
Categories, topics:
External Debt
Last updated:
apr 23, 2017
Indicators value changes by year
Minimum:
1.046 mln
jan 1, 2009
Maximum:
961.923 mln
jan 1, 2016
At the date of observation
Value
Absolute change
Change from previous value
jan 1, 2009
1.046 mln
+1.046 mln
0.0%
jan 1, 2010
8.425 mln
+7.379 mln
705.45%
jan 1, 2011
17.664 mln
+9.239 mln
109.66%
jan 1, 2012
23.764 mln
+6.1 mln
34.53%
jan 1, 2013
814.252 mln
+790.488 mln
3.33K%
jan 1, 2014
813.917 mln
-335.0K
-0.04%
jan 1, 2015
806.641 mln
-7.276 mln
-0.89%
jan 1, 2016
961.923 mln
+155.282 mln
19.25%
Ranking of countries by current statistics by years


Comments: