29
/
en
AIzaSyAYiBZKx7MnpbEhh9jyipgxe19OcubqV5w
April 1, 2024
199075
Mongolia
MNG
true
2
1
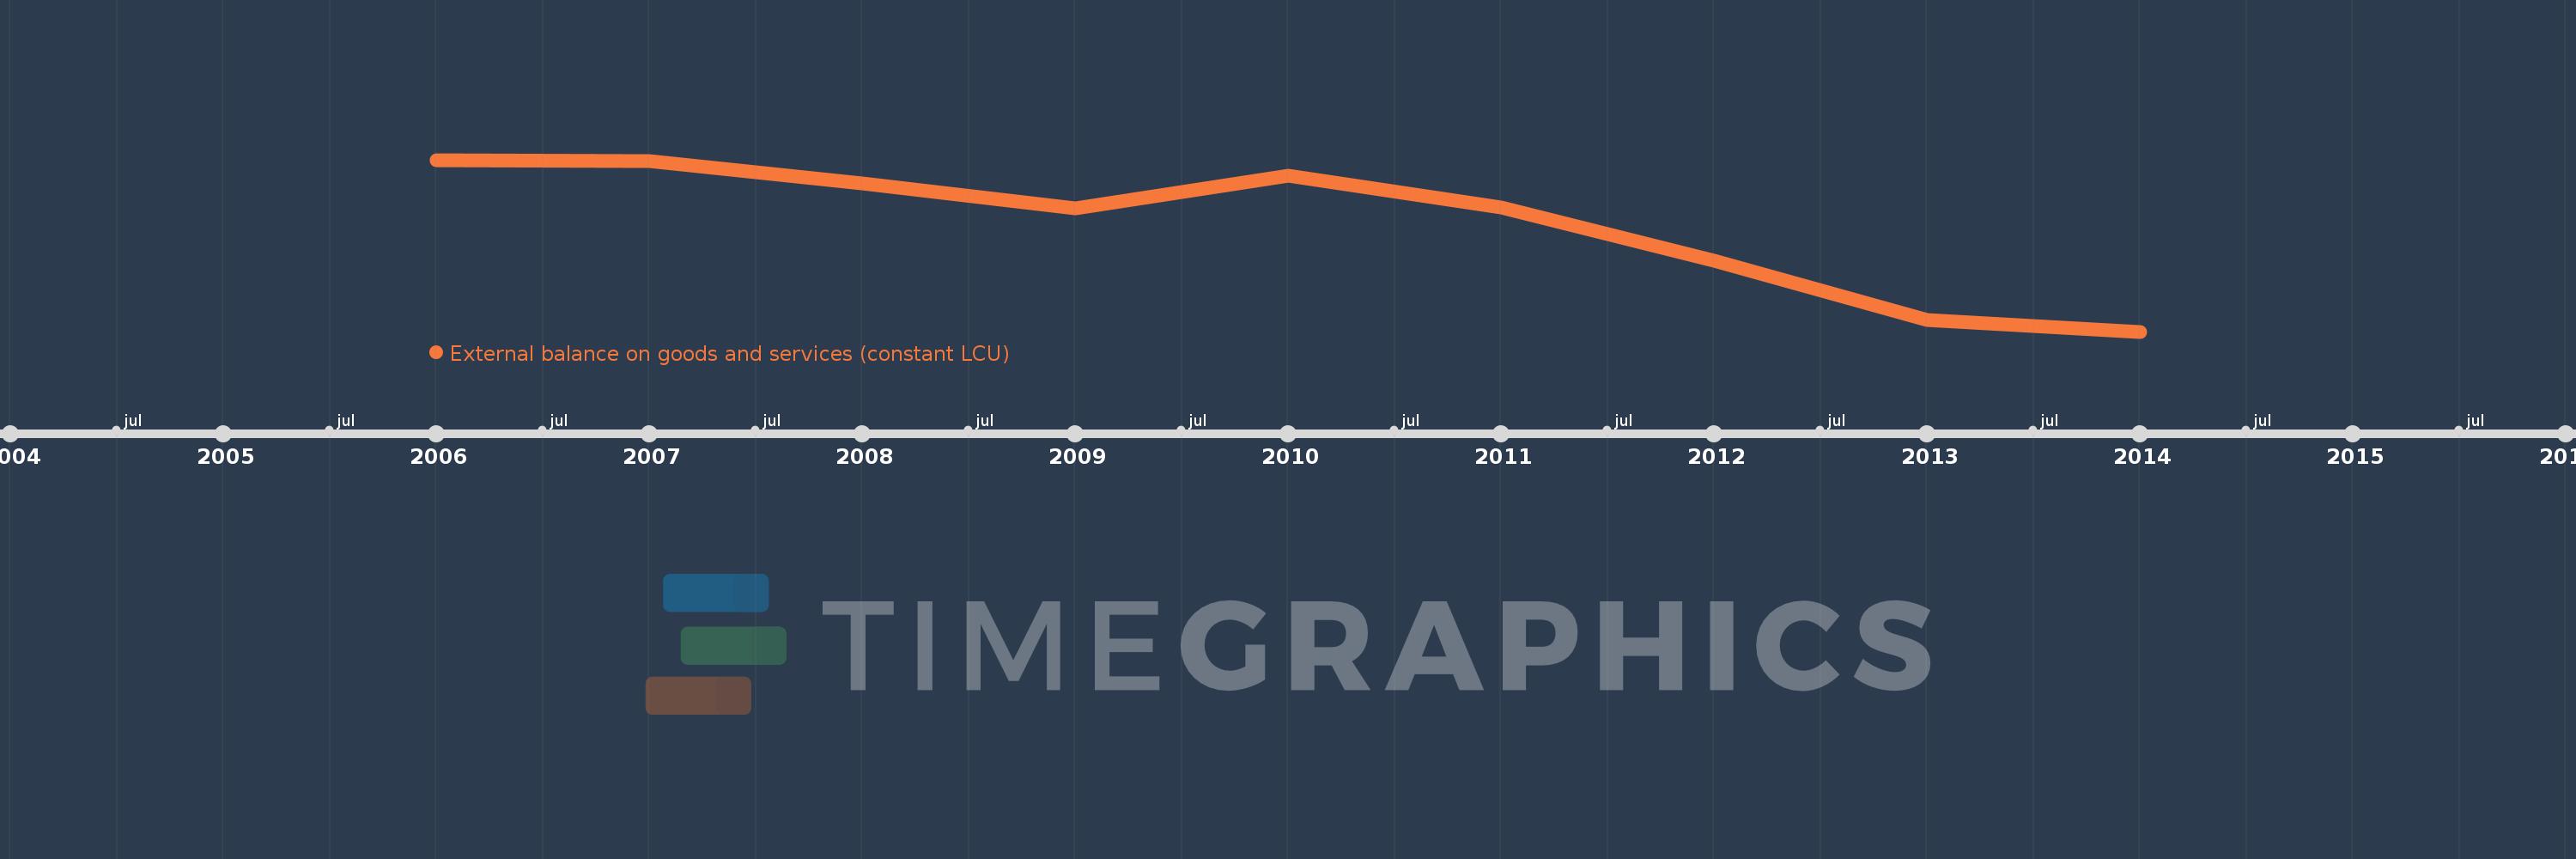
External balance on goods and services (constant LCU)
2014,2013,2012,2011,2010,2009,2008,2007,2006
This statistics in other country:
AlbaniaAlgeriaAngolaArgentinaArmeniaAustraliaAustriaAzerbaijanBahamas, TheBahrainBangladeshBarbadosBelarusBelgiumBelizeBeninBhutanBoliviaBosnia and HerzegovinaBotswanaBrazilBrunei DarussalamBulgariaBurkina FasoBurundiCabo VerdeCambodiaCameroonCanadaCentral African RepublicChadChileChinaColombiaComorosCongo, Dem. Rep.Congo, Rep.Costa RicaCote d'IvoireCroatiaCubaCyprusCzech RepublicDenmarkDjiboutiDominican RepublicEcuadorEgypt, Arab Rep.El SalvadorEquatorial GuineaEritreaEstoniaFijiFinlandFranceGabonGambia, TheGermanyGhanaGreeceGuatemalaGuineaHaitiHondurasHong Kong SAR, ChinaHungaryIcelandIndiaIndonesiaIran, Islamic Rep.IrelandIsraelItalyJamaicaJapanJordanKazakhstanKenyaKorea, Rep.KuwaitKyrgyz RepublicLatviaLebanonLesothoLiberiaLithuaniaLuxembourgMacao SAR, ChinaMacedonia, FYRMadagascarMalawiMalaysiaMaldivesMaliMaltaMauritaniaMauritiusMexicoMoldovaMongoliaMontenegroMoroccoMozambiqueMyanmarNamibiaNepalNetherlandsNew ZealandNicaraguaNigerNigeriaNorwayOmanPakistanPanamaPapua New GuineaParaguayPeruPhilippinesPolandPortugalPuerto RicoRomaniaRussian FederationRwandaSamoaSaudi ArabiaSenegalSerbiaSeychellesSierra LeoneSingaporeSlovak RepublicSloveniaSomaliaSouth AfricaSouth SudanSpainSri LankaSudanSwazilandSwedenSwitzerlandSyrian Arab RepublicTajikistanTanzaniaThailandTimor-LesteTogoTrinidad and TobagoTunisiaTurkeyTurkmenistanUgandaUkraineUnited Arab EmiratesUnited KingdomUnited StatesUruguayUzbekistanVenezuela, RBVietnamWest Bank and GazaZambiaZimbabwe Timeline:
This timeline shows a graph from 2006 to 2014 of Mongolia. No data until 2005. Number of actual observations by date: 9.
Source name:
World Development Indicators
Source organization:
World Bank national accounts data, and OECD National Accounts data files.
Categories, topics:
Economy & Growth
Last updated:
apr 23, 2017
Indicators value changes by year
Minimum:
-3.21 trl
jan 1, 2014
Maximum:
-147.286 bln
jan 1, 2006
At the date of observation
Value
Absolute change
Change from previous value
jan 1, 2006
-147.286 bln
-147.286 bln
0.0%
jan 1, 2007
-167.678 bln
-20.393 bln
13.85%
jan 1, 2008
-564.828 bln
-397.15 bln
236.85%
jan 1, 2009
-1.02 trl
-455.021 bln
80.56%
jan 1, 2010
-429.389 bln
+590.46 bln
-57.9%
jan 1, 2011
-993.142 bln
-563.753 bln
131.29%
jan 1, 2012
-1.95 trl
-956.372 bln
96.3%
jan 1, 2013
-3.01 trl
-1.06 trl
54.39%
jan 1, 2014
-3.21 trl
-200.157 bln
6.65%
Ranking of countries by current statistics by years


Comments: