29
/
en
AIzaSyAYiBZKx7MnpbEhh9jyipgxe19OcubqV5w
April 1, 2024
198115
Moldova
MDA
true
2
1
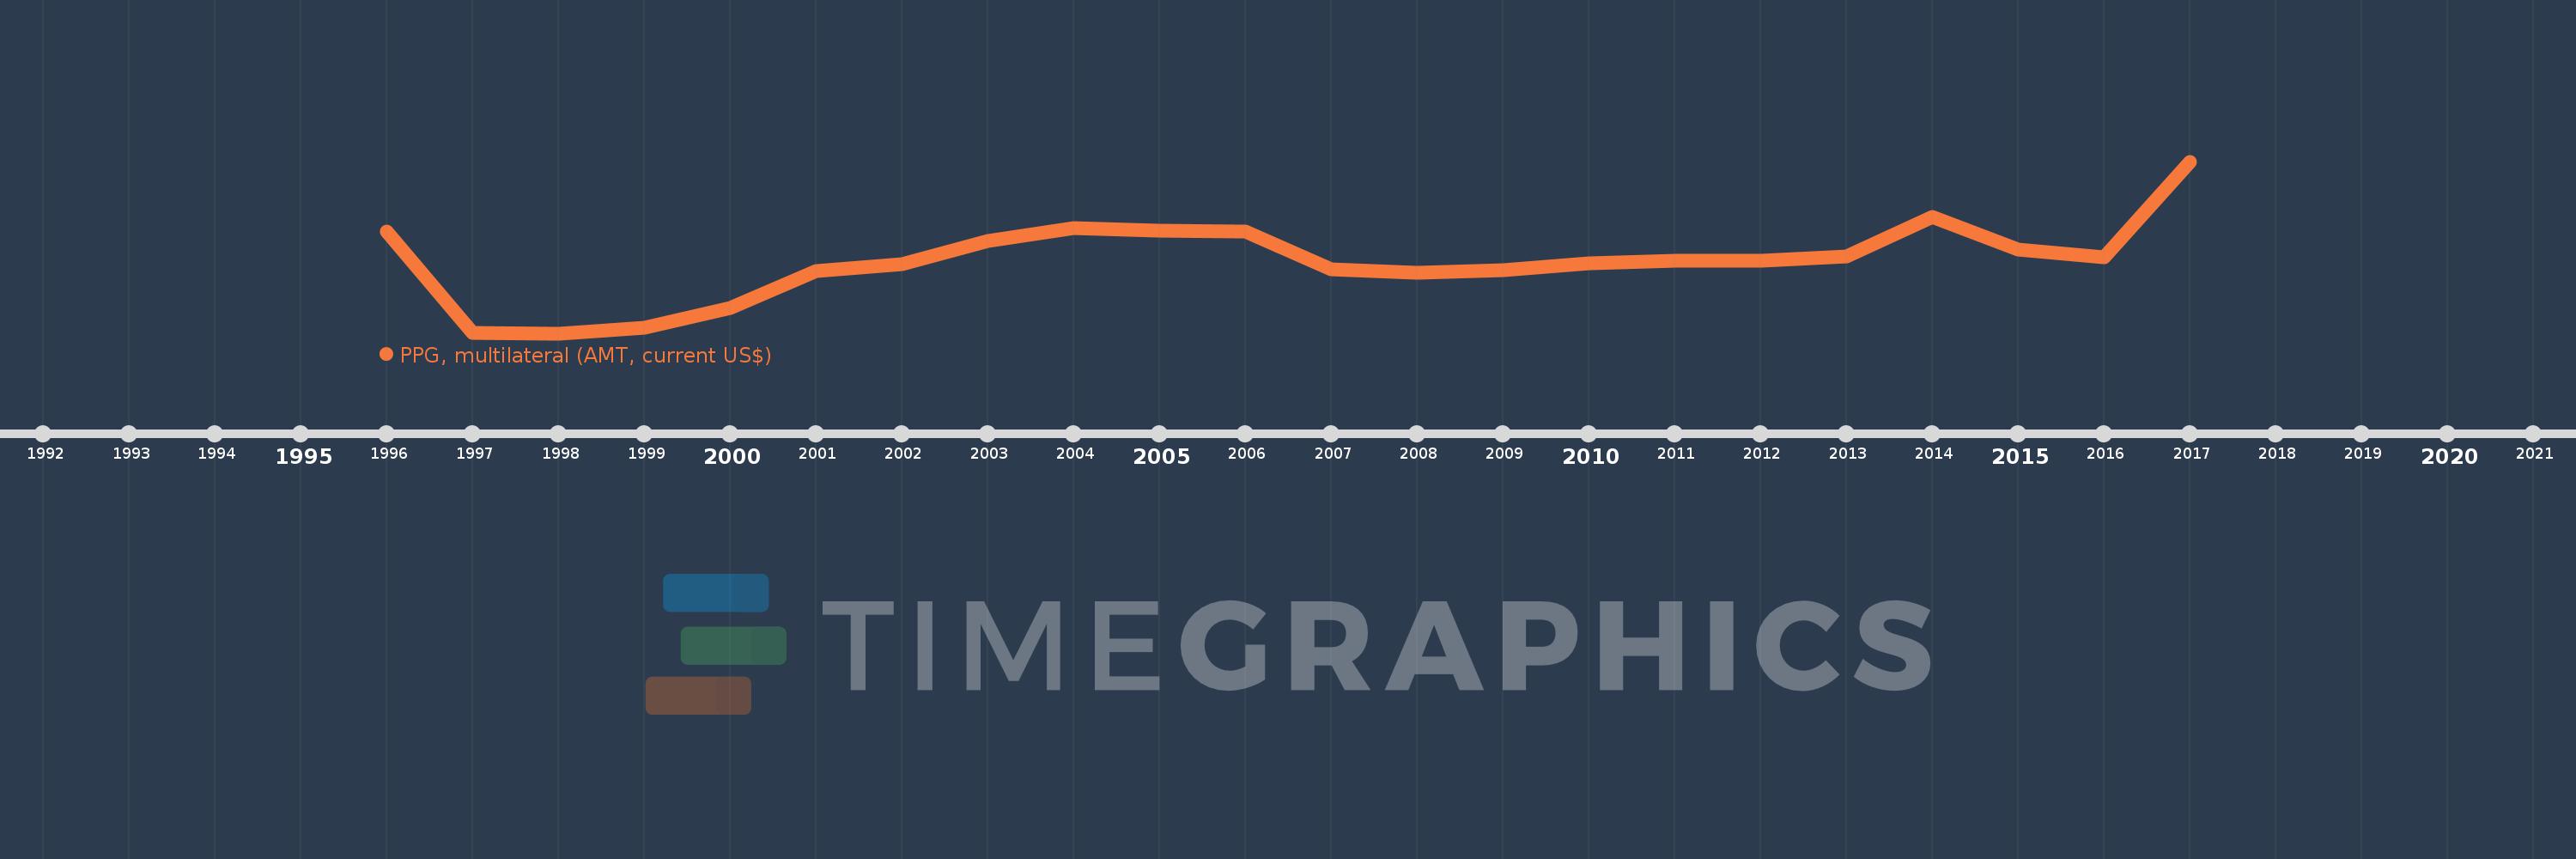
PPG, multilateral (AMT, current US$)
2017,2016,2015,2014,2013,2012,2011,2010,2009,2008,2007,2006,2005,2004,2003,2002,2001,2000,1999,1998,1997,1996
This statistics in other country:
Timeline:
This timeline shows a graph from 1996 to 2017 of Moldova. No data until 1995. Number of actual observations by date: 22.
Source name:
World Development Indicators
Source organization:
World Bank, International Debt Statistics.
Categories, topics:
External Debt
Last updated:
apr 23, 2017
Indicators value changes by year
Minimum:
887.0K
jan 1, 1998
Maximum:
58.998 mln
jan 1, 2017
At the date of observation
Value
Absolute change
Change from previous value
jan 1, 1996
35.32 mln
+35.32 mln
0.0%
jan 1, 1997
895.0K
-34.425 mln
-97.47%
jan 1, 1998
887.0K
-8.0K
-0.89%
jan 1, 1999
2.743 mln
+1.856 mln
209.24%
jan 1, 2000
9.593 mln
+6.85 mln
249.73%
jan 1, 2001
21.812 mln
+12.219 mln
127.37%
jan 1, 2002
24.148 mln
+2.336 mln
10.71%
jan 1, 2003
31.987 mln
+7.839 mln
32.46%
jan 1, 2004
36.484 mln
+4.497 mln
14.06%
jan 1, 2005
35.627 mln
-857.0K
-2.35%
jan 1, 2006
35.19 mln
-437.0K
-1.23%
jan 1, 2007
22.581 mln
-12.609 mln
-35.83%
jan 1, 2008
21.247 mln
-1.334 mln
-5.91%
jan 1, 2009
22.278 mln
+1.031 mln
4.85%
jan 1, 2010
24.541 mln
+2.263 mln
10.16%
jan 1, 2011
25.416 mln
+875.0K
3.57%
jan 1, 2012
25.583 mln
+167.0K
0.66%
jan 1, 2013
26.964 mln
+1.381 mln
5.4%
jan 1, 2014
40.339 mln
+13.375 mln
49.6%
jan 1, 2015
29.298 mln
-11.041 mln
-27.37%
jan 1, 2016
26.542 mln
-2.756 mln
-9.41%
jan 1, 2017
58.998 mln
+32.456 mln
122.28%
Ranking of countries by current statistics by years


Comments: