29
/
en
AIzaSyAYiBZKx7MnpbEhh9jyipgxe19OcubqV5w
April 1, 2024
197975
Moldova
MDA
true
2
1
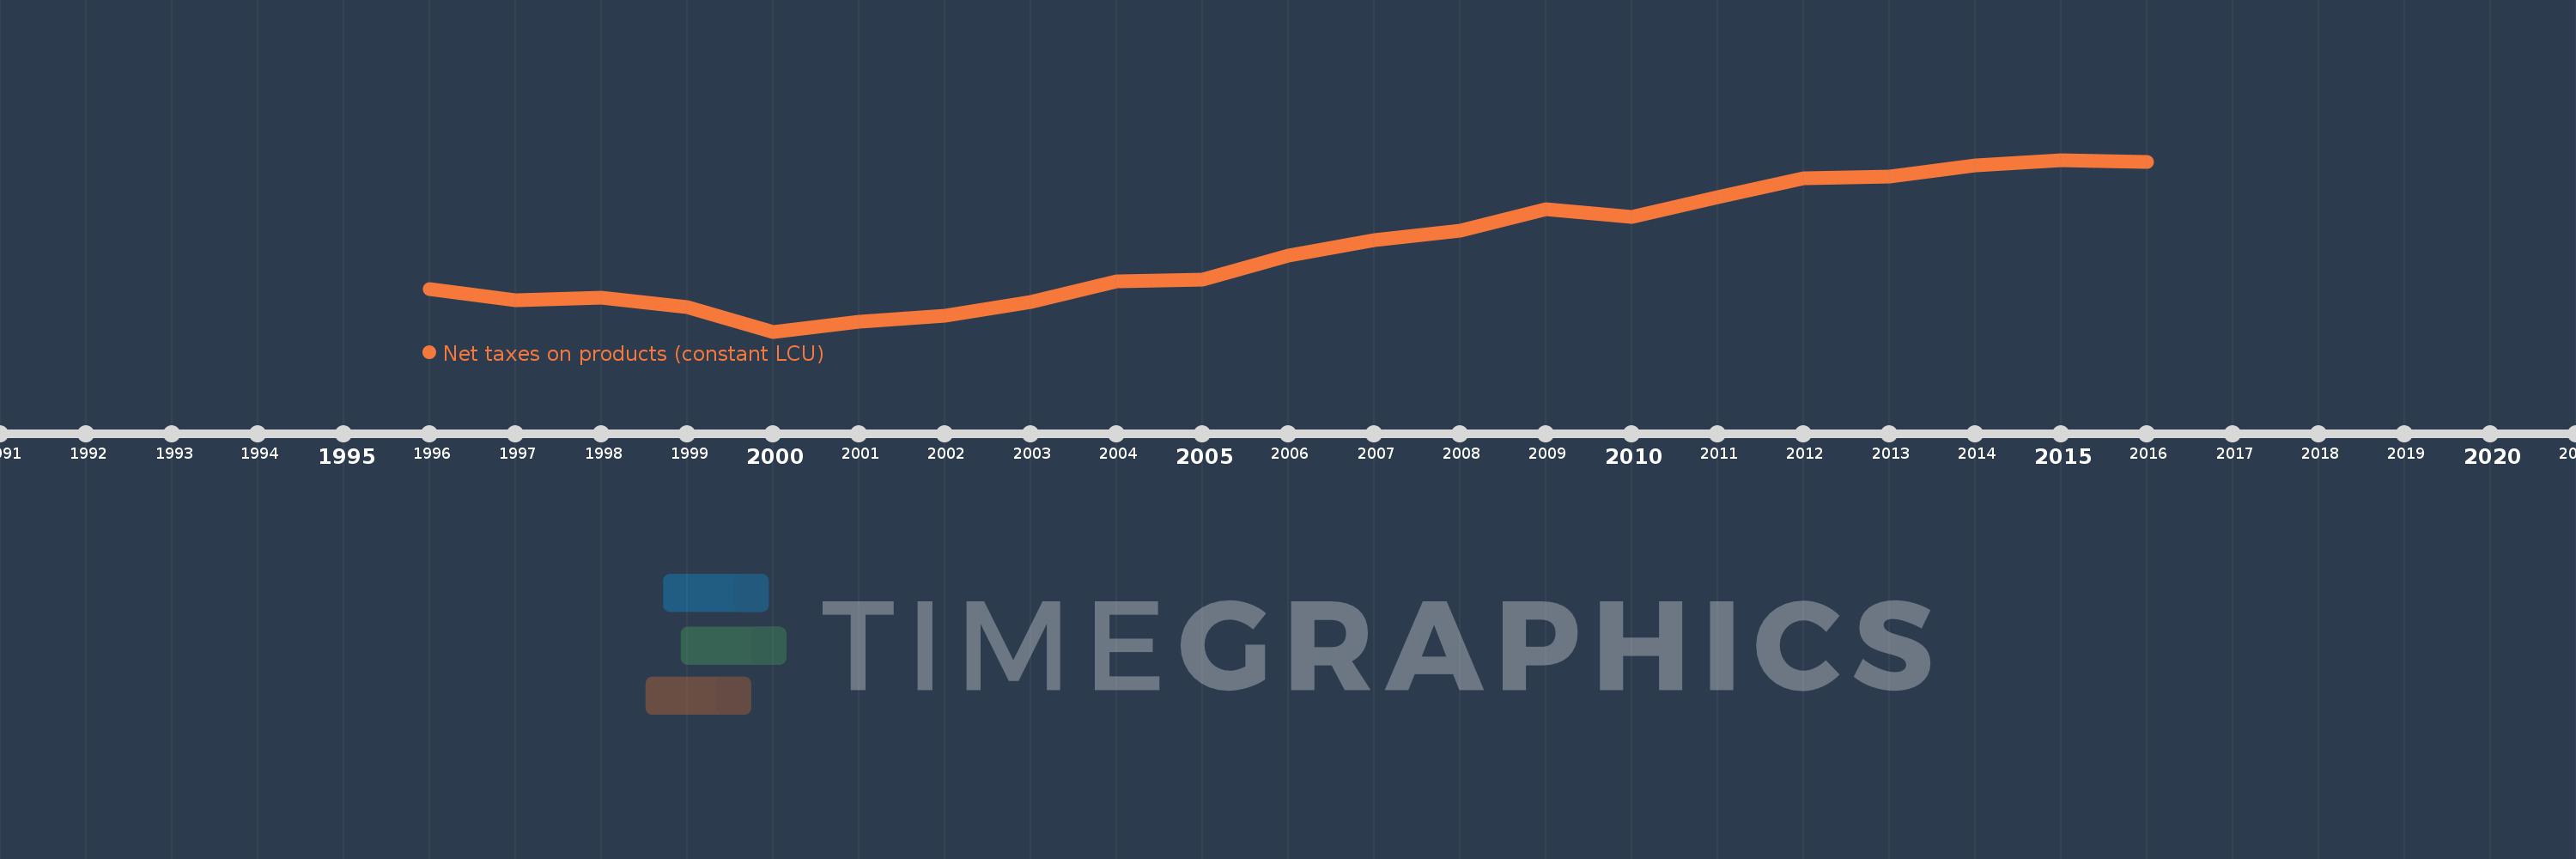
Net taxes on products (constant LCU)
2016,2015,2014,2013,2012,2011,2010,2009,2008,2007,2006,2005,2004,2003,2002,2001,2000,1999,1998,1997,1996
This statistics in other country:
Timeline:
This timeline shows a graph from 1996 to 2016 of Moldova. No data until 1995. Number of actual observations by date: 21.
Source name:
World Development Indicators
Source organization:
World Bank national accounts data, and OECD National Accounts data files.
Categories, topics:
Economy & Growth
Last updated:
apr 23, 2017
Indicators value changes by year
Minimum:
1.705 bln
jan 1, 2000
Maximum:
6.687 bln
jan 1, 2015
At the date of observation
Value
Absolute change
Change from previous value
jan 1, 1996
2.932 bln
+2.932 bln
0.0%
jan 1, 1997
2.621 bln
-311.328 mln
-10.62%
jan 1, 1998
2.7 bln
+79.323 mln
3.03%
jan 1, 1999
2.418 bln
-282.413 mln
-10.46%
jan 1, 2000
1.705 bln
-713.146 mln
-29.49%
jan 1, 2001
1.998 bln
+292.711 mln
17.17%
jan 1, 2002
2.169 bln
+171.271 mln
8.57%
jan 1, 2003
2.553 bln
+384.267 mln
17.72%
jan 1, 2004
3.15 bln
+597.448 mln
23.4%
jan 1, 2005
3.218 bln
+67.16 mln
2.13%
jan 1, 2006
3.915 bln
+697.572 mln
21.68%
jan 1, 2007
4.347 bln
+431.618 mln
11.02%
jan 1, 2008
4.639 bln
+291.992 mln
6.72%
jan 1, 2009
5.248 bln
+608.692 mln
13.12%
jan 1, 2010
5.028 bln
-219.864 mln
-4.19%
jan 1, 2011
5.614 bln
+586.225 mln
11.66%
jan 1, 2012
6.152 bln
+537.81 mln
9.58%
jan 1, 2013
6.201 bln
+49.214 mln
0.8%
jan 1, 2014
6.517 bln
+316.246 mln
5.1%
jan 1, 2015
6.687 bln
+169.446 mln
2.6%
jan 1, 2016
6.633 bln
-53.493 mln
-0.8%
Ranking of countries by current statistics by years


Comments: