29
/
en
AIzaSyAYiBZKx7MnpbEhh9jyipgxe19OcubqV5w
April 1, 2024
195184
Mexico
MEX
true
2
1
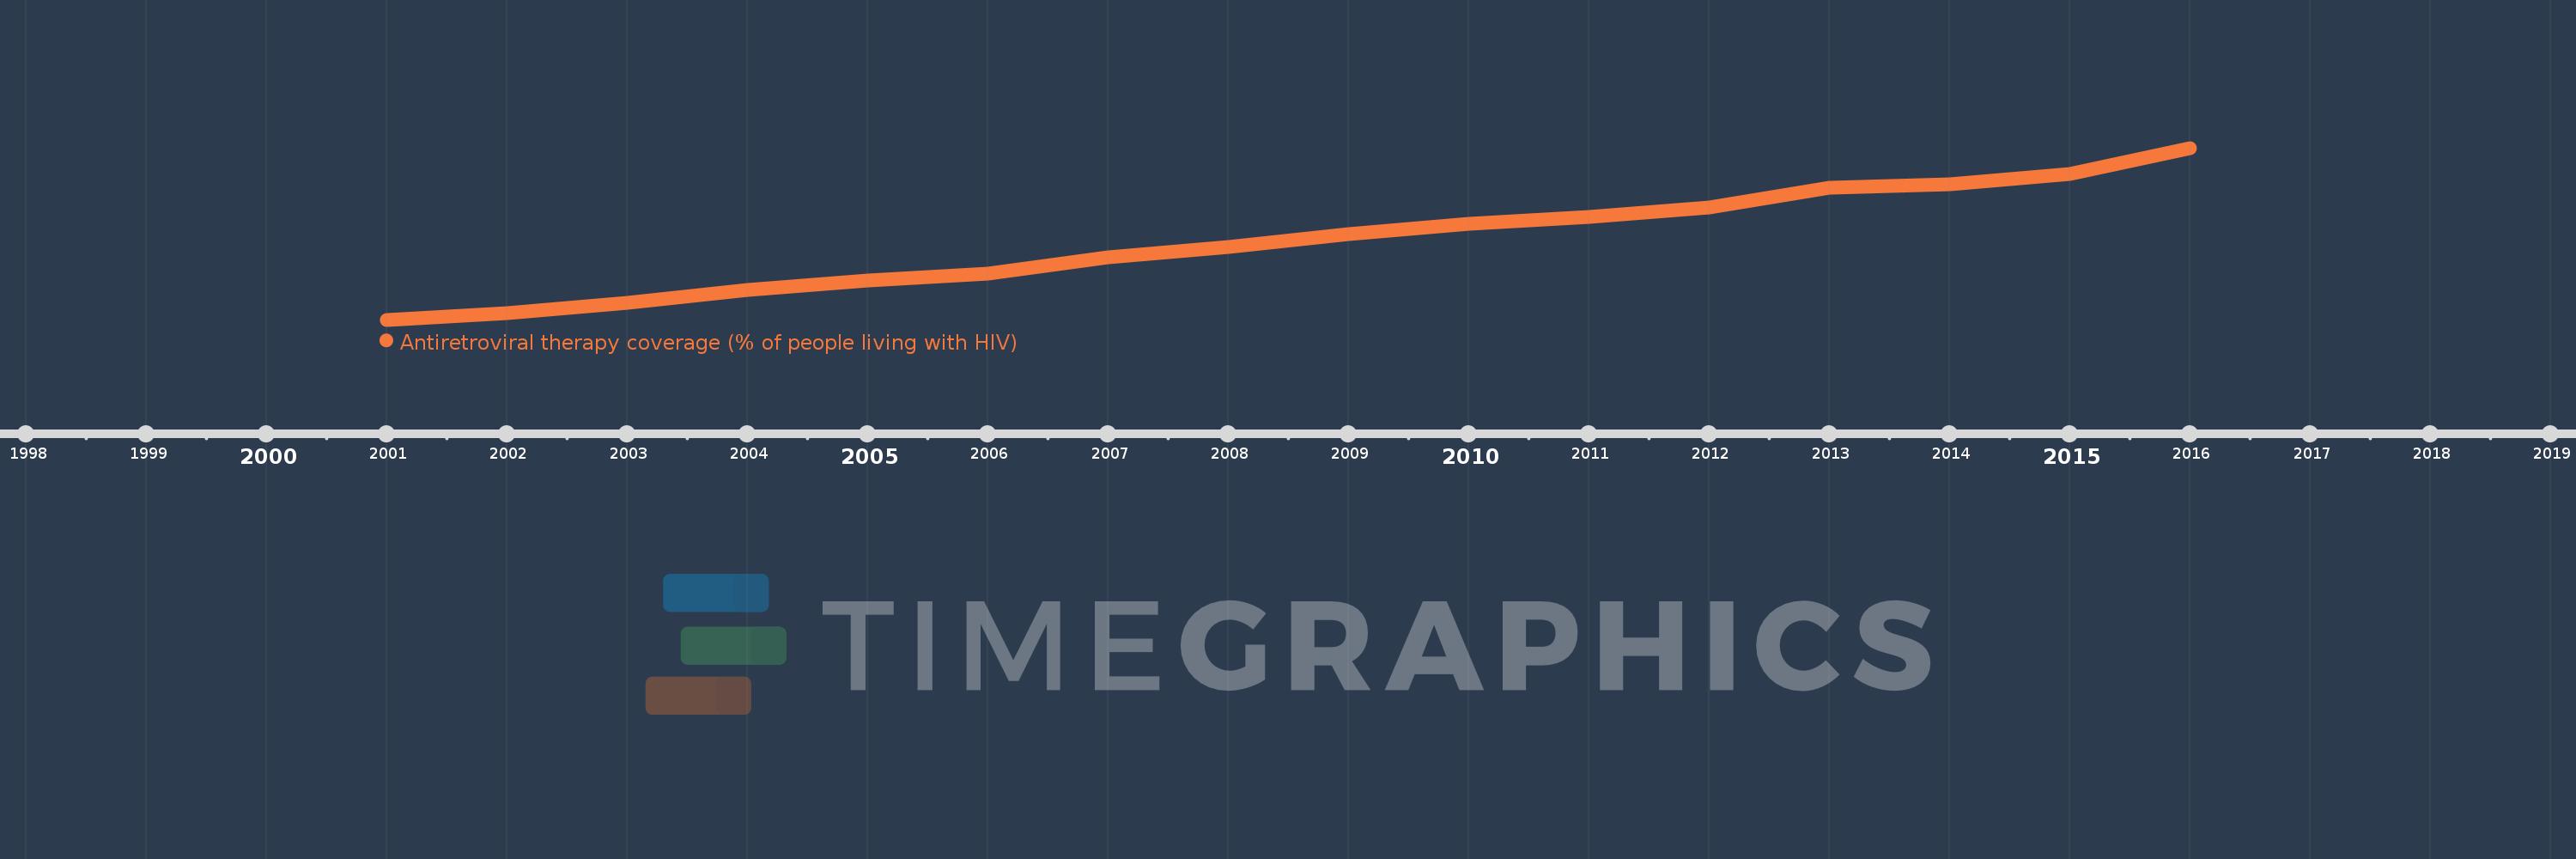
Antiretroviral therapy coverage (% of people living with HIV)
2016,2015,2014,2013,2012,2011,2010,2009,2008,2007,2006,2005,2004,2003,2002,2001
This statistics in other country:
Timeline:
This timeline shows a graph from 2001 to 2016 of Mexico. No data until 2000. Number of actual observations by date: 16.
Source name:
World Development Indicators
Source organization:
UNAIDS estimates.
Categories, topics:
Health
Last updated:
apr 23, 2017
Indicators value changes by year
At the date of observation
Value
Absolute change
Change from previous value
jan 1, 2002
9.0
+2.0
28.57%
jan 1, 2003
12.0
+3.0
33.33%
jan 1, 2004
16.0
+4.0
33.33%
jan 1, 2005
19.0
+3.0
18.75%
jan 1, 2006
21.0
+2.0
10.53%
jan 1, 2007
26.0
+5.0
23.81%
jan 1, 2008
29.0
+3.0
11.54%
jan 1, 2009
33.0
+4.0
13.79%
jan 1, 2010
36.0
+3.0
9.09%
jan 1, 2011
38.0
+2.0
5.56%
jan 1, 2012
41.0
+3.0
7.89%
jan 1, 2013
47.0
+6.0
14.63%
jan 1, 2014
48.0
+1.0
2.13%
jan 1, 2015
51.0
+3.0
6.25%
jan 1, 2016
59.0
+8.0
15.69%
Ranking of countries by current statistics by years


Comments: