29
/
en
AIzaSyAYiBZKx7MnpbEhh9jyipgxe19OcubqV5w
April 1, 2024
193520
Mauritania
MRT
true
2
1
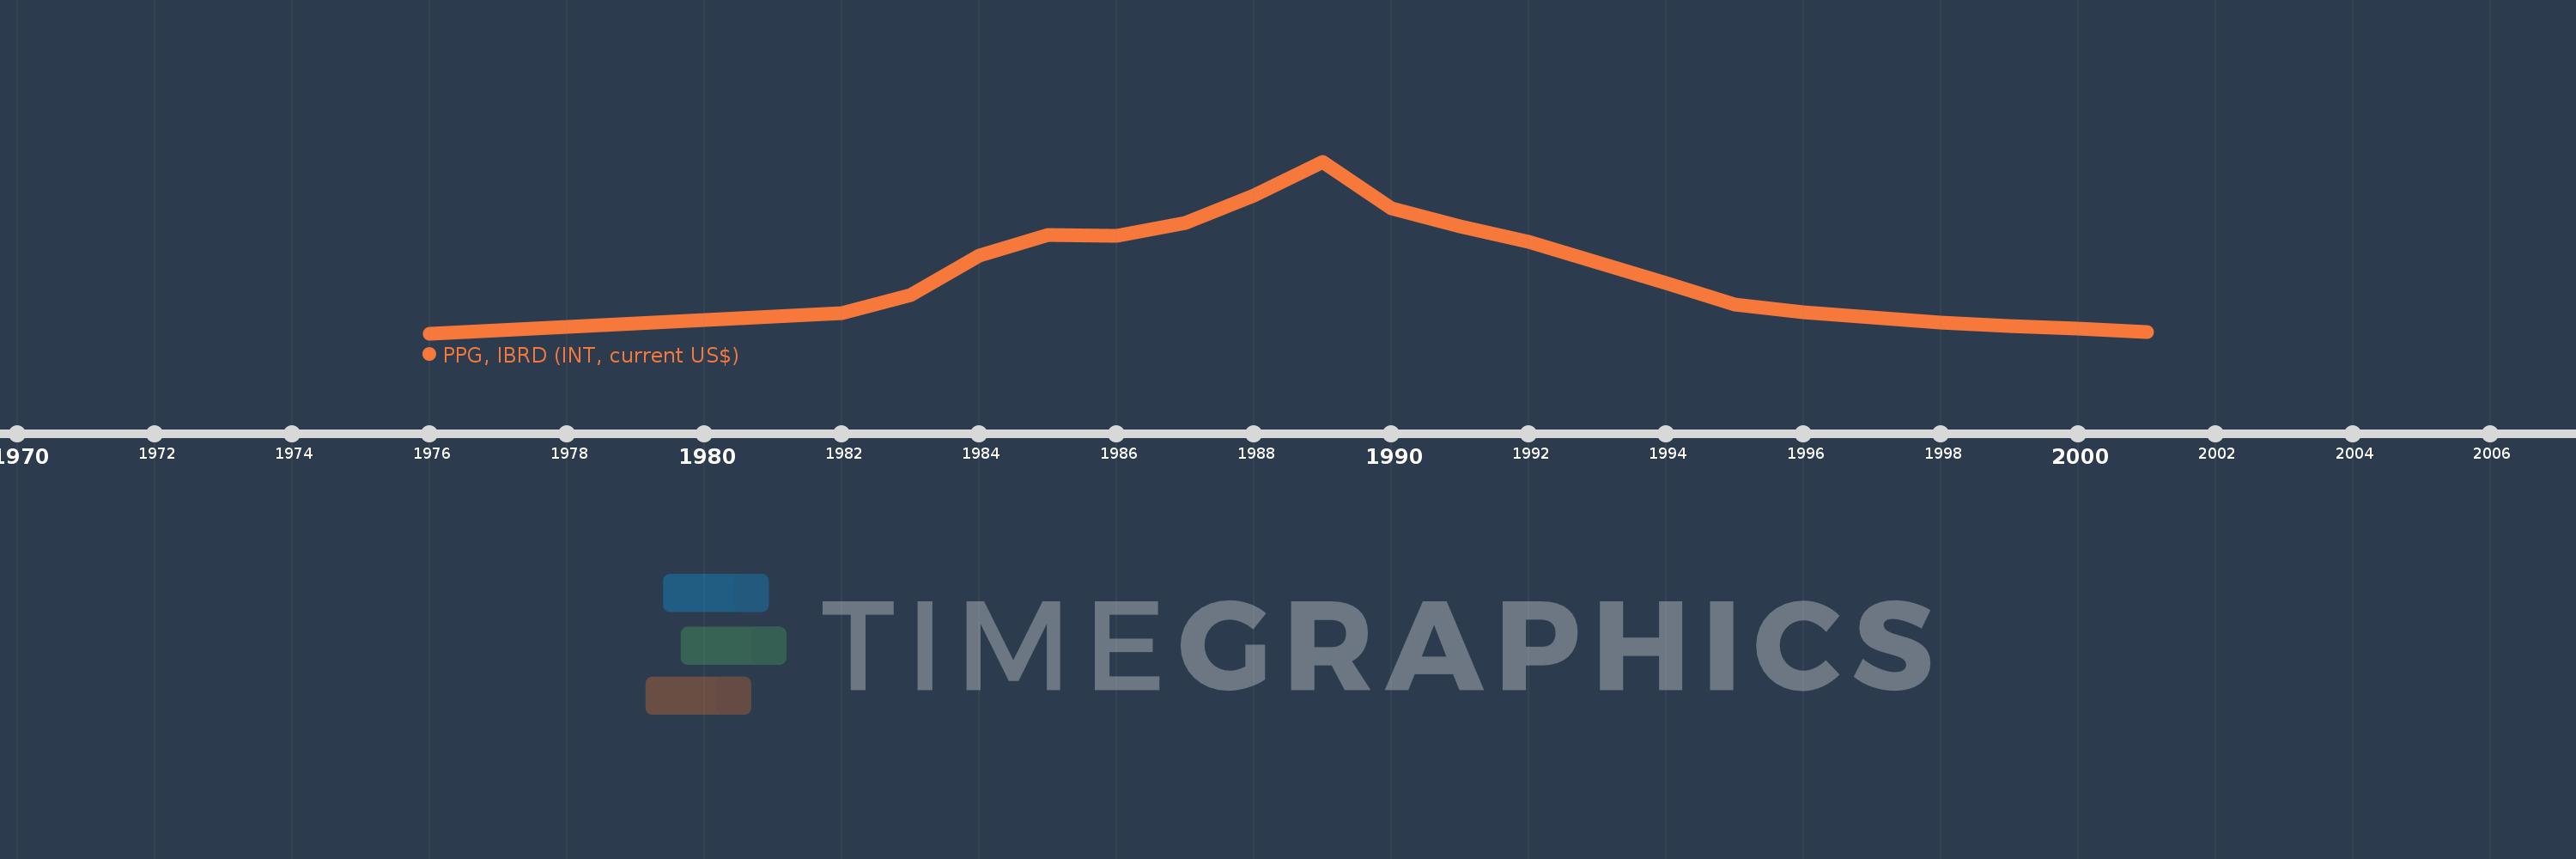
PPG, IBRD (INT, current US$)
2001,2000,1999,1998,1997,1996,1995,1994,1993,1992,1991,1990,1989,1988,1987,1986,1985,1984,1983,1982,1976
This statistics in other country:
Timeline:
This timeline shows a graph from 1976 to 2001 of Mauritania. No data until 1975. Number of actual observations by date: 21.
Source name:
World Development Indicators
Source organization:
World Bank, International Debt Statistics.
Categories, topics:
External Debt
Last updated:
apr 23, 2017
Indicators value changes by year
Maximum:
7.224 mln
jan 1, 1989
At the date of observation
Value
Absolute change
Change from previous value
jan 1, 1976
12.0K
+12.0K
0.0%
jan 1, 1982
873.0K
+861.0K
7.17K%
jan 1, 1983
1.631 mln
+758.0K
86.83%
jan 1, 1984
3.274 mln
+1.643 mln
100.74%
jan 1, 1985
4.132 mln
+858.0K
26.21%
jan 1, 1986
4.095 mln
-37.0K
-0.9%
jan 1, 1987
4.651 mln
+556.0K
13.58%
jan 1, 1988
5.799 mln
+1.148 mln
24.68%
jan 1, 1989
7.224 mln
+1.425 mln
24.57%
jan 1, 1990
5.268 mln
-1.956 mln
-27.08%
jan 1, 1991
4.497 mln
-771.0K
-14.64%
jan 1, 1992
3.86 mln
-637.0K
-14.16%
jan 1, 1993
3.001 mln
-859.0K
-22.25%
jan 1, 1994
2.126 mln
-875.0K
-29.16%
jan 1, 1995
1.209 mln
-917.0K
-43.13%
jan 1, 1996
904.0K
-305.0K
-25.23%
jan 1, 1997
667.0K
-237.0K
-26.22%
jan 1, 1998
468.0K
-199.0K
-29.84%
jan 1, 1999
313.0K
-155.0K
-33.12%
jan 1, 2000
214.0K
-99.0K
-31.63%
jan 1, 2001
76.0K
-138.0K
-64.49%
Ranking of countries by current statistics by years


Comments: